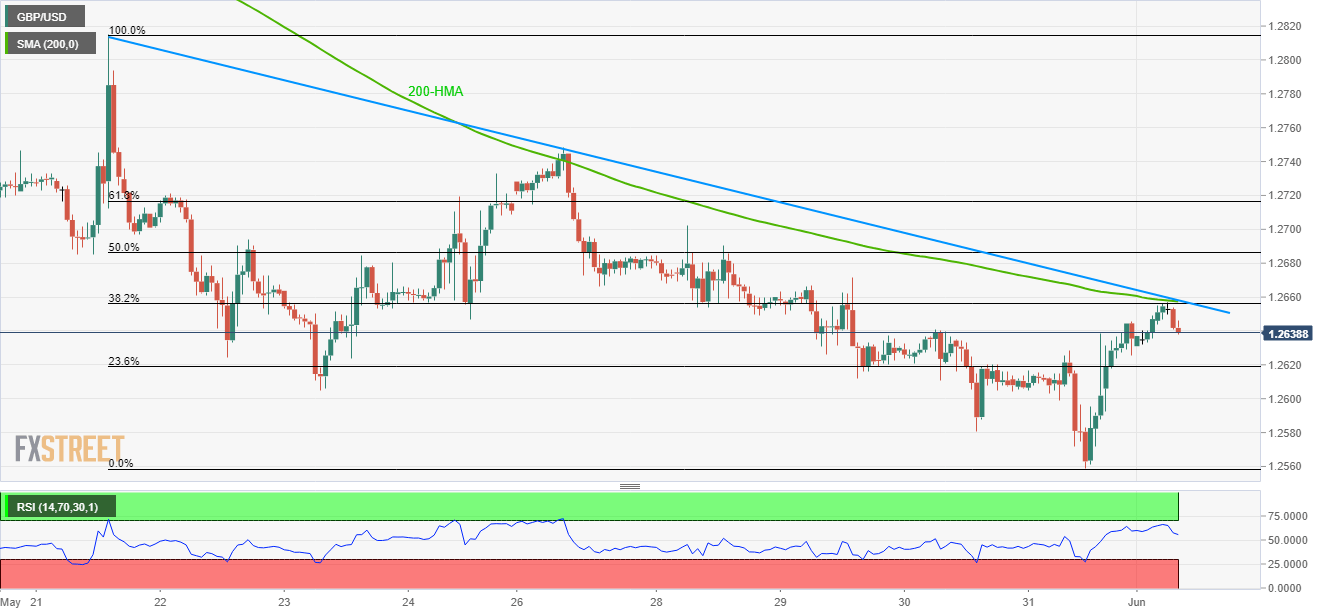
- 200-HMA, 38.2% Fibonacci retracement and near-term trend-line limits immediate upside.
- 1.2600 seems short-term sellers’ favorite
With its latest pullback from 1.2655/60 resistance-confluence, the GBP/USD pair traders near 1.2640 ahead of the UK open on Monday.
Failure to cross the confluence region portrayed by 200-hour moving average, more than 10-day long descending trend-line and 38.2% Fibonacci retracement of its late-may downturn favor the Cable sellers targeting 23.6% Fibonacci retracement level of 1.2620 as immediate support.
During the quote’s declines under 1.2620, 1.2600 round-figure could gain high importance ahead of diverting bears to 1.2560.
Alternatively, pair’s rise past-1.2660 enables it to question 1.2690 and 1.2715 resistances respectively comprising 50% and 61.8% Fibonacci retracements levels.
If bulls refrain from relinquishing their command above 1.2715, late-May tops near 1.2750 and high of May 21around 1.2815 could flash on their list.
GBP/USD hourly chart
Trend: Pullback expected
