- The trade war has sparked a wave of safe-haven flow as investors are turning towards the yellow metal.
- Bulls have broken the 1,300.00 mark. Can they reach the 2019 high?
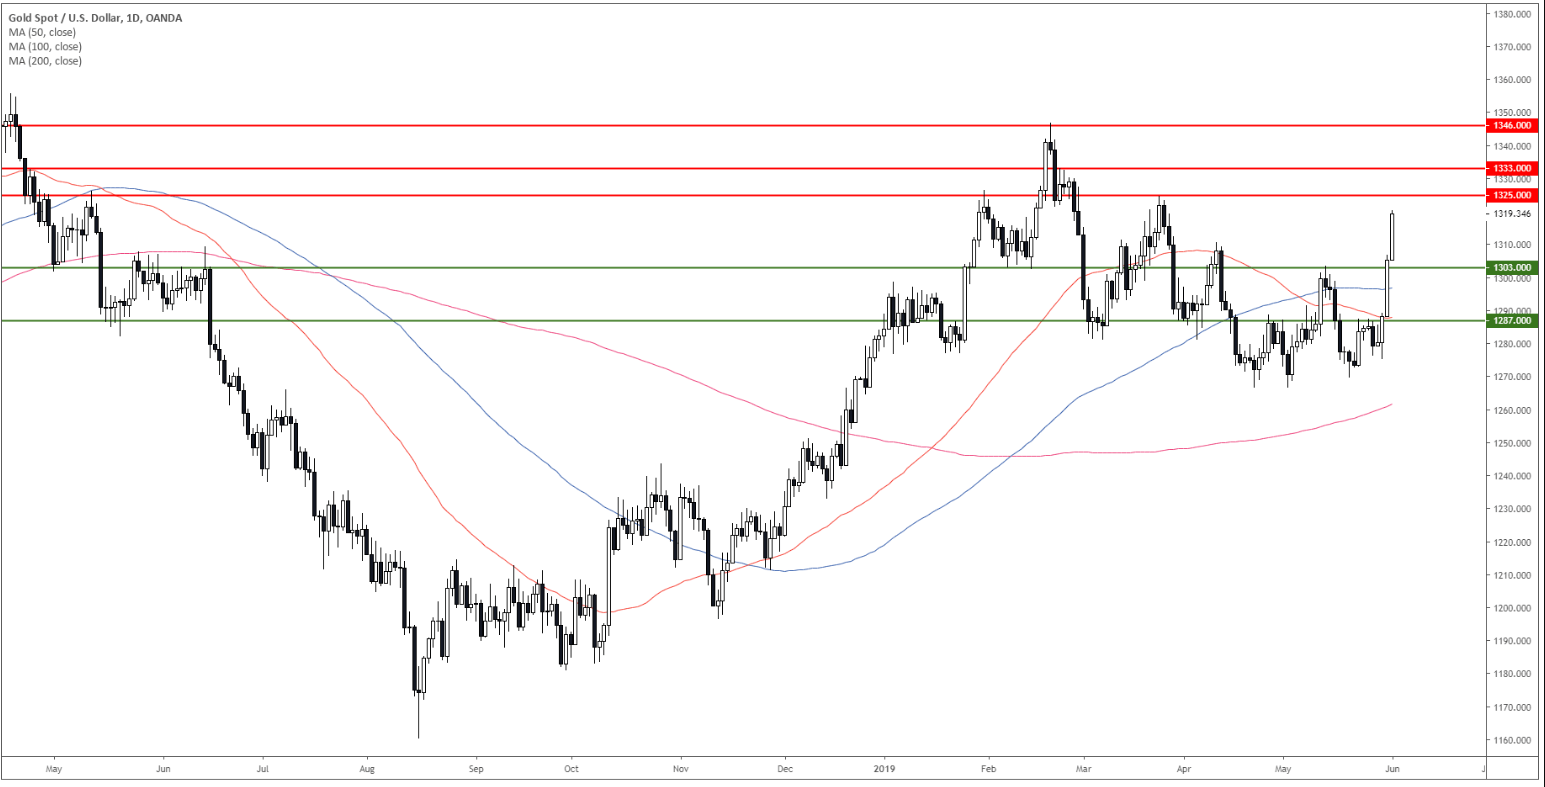
Gold daily chart
Gold is trading above $1,300.00/oz and its main simple moving averages (SMAs) suggesting bullish momentum.
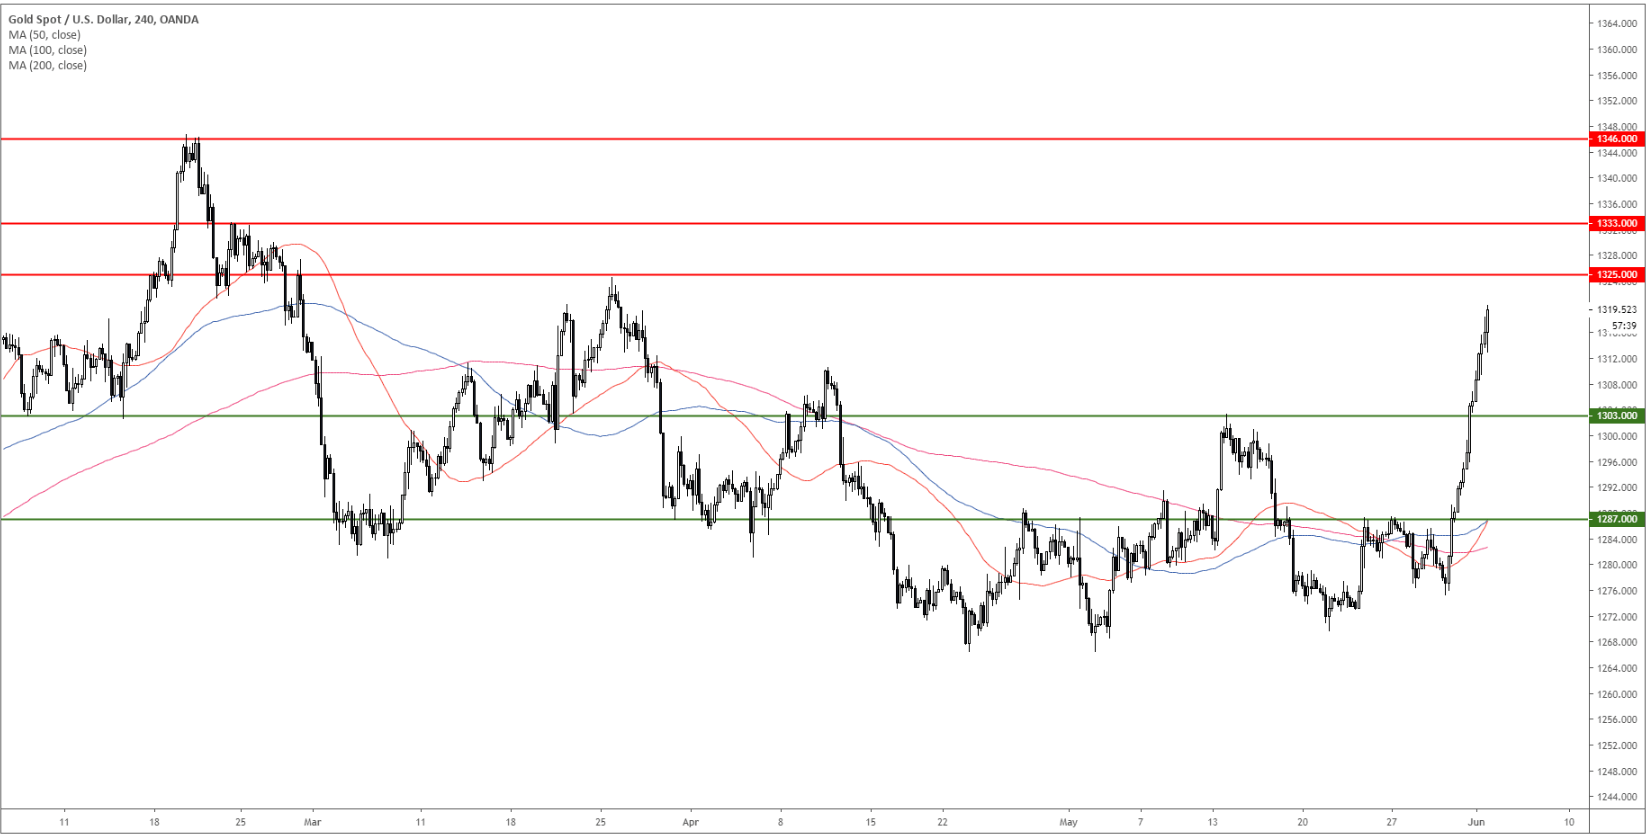
Gold 4-hour chart
Gold is trading above its main simple moving averages (SMAs) as bulls want to reach 1,325.00, 1,333.00 and 1,346.00 to the upside. Support is seen at 1,303.00 and 1,247.00.
Additional key levels
