- GBP/USD has been under strong selling pressure in the last weeks.
- GBP/USD is recovering some of its losses but more work needs to be done for bulls.
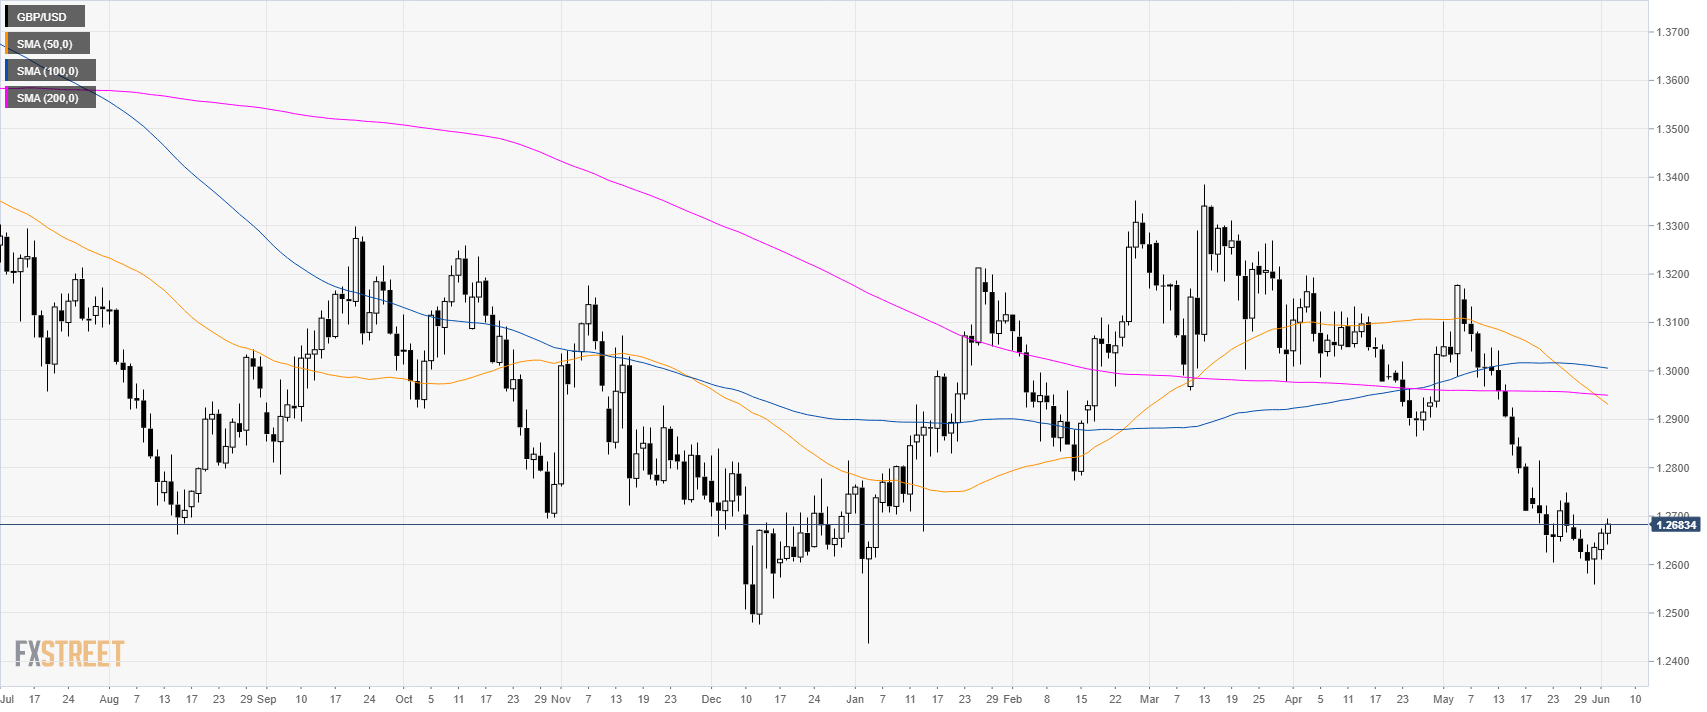
GBP/USD daily chart
GBP/USD is up for the third consecutive day as the market is trading below its main simple moving averages (SMAs).
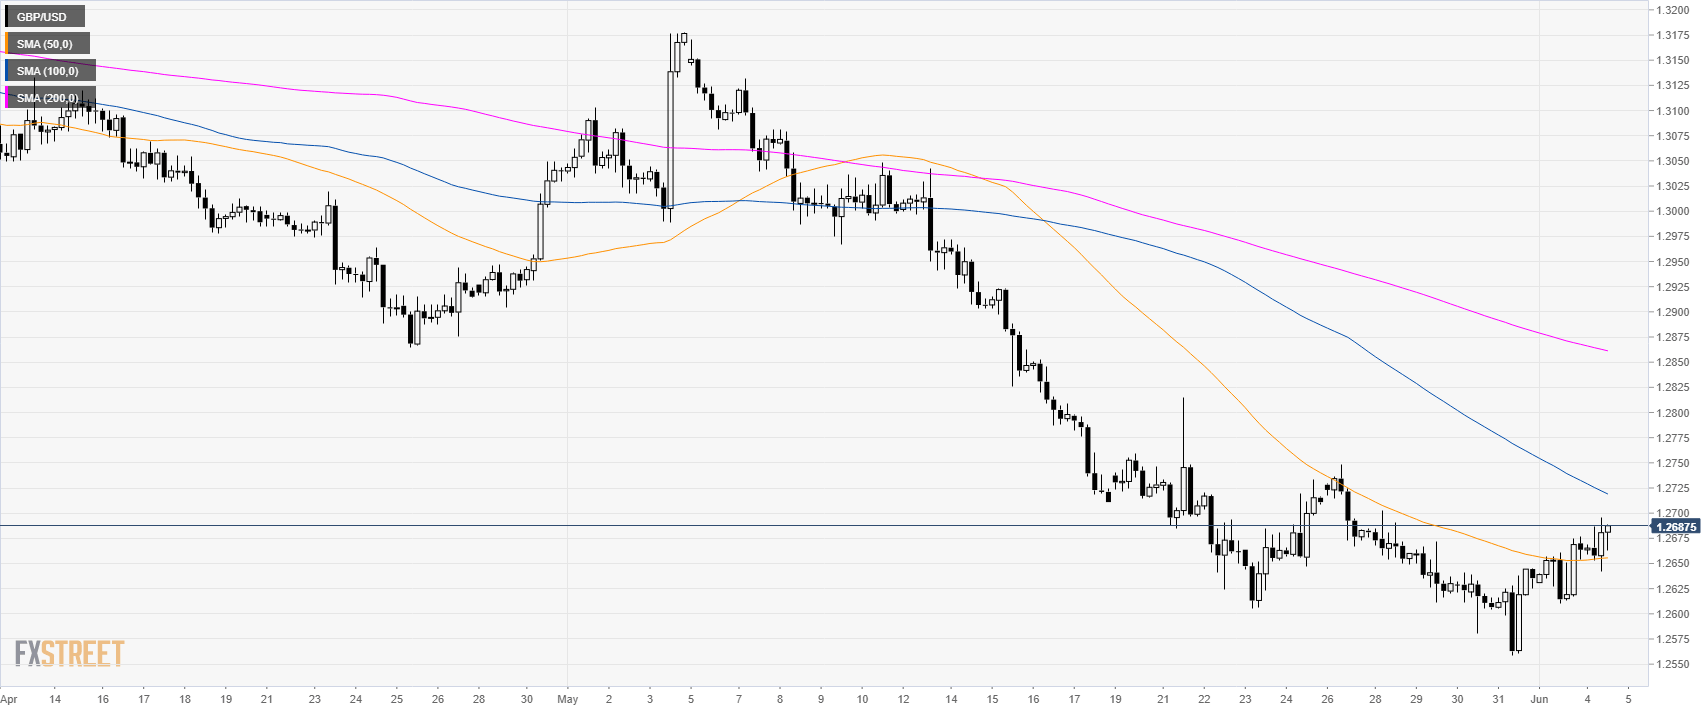
GBP/USD 4-hour chart
Cable is challenging the 1.2700 figure as the market is trading above the 50 SMA.
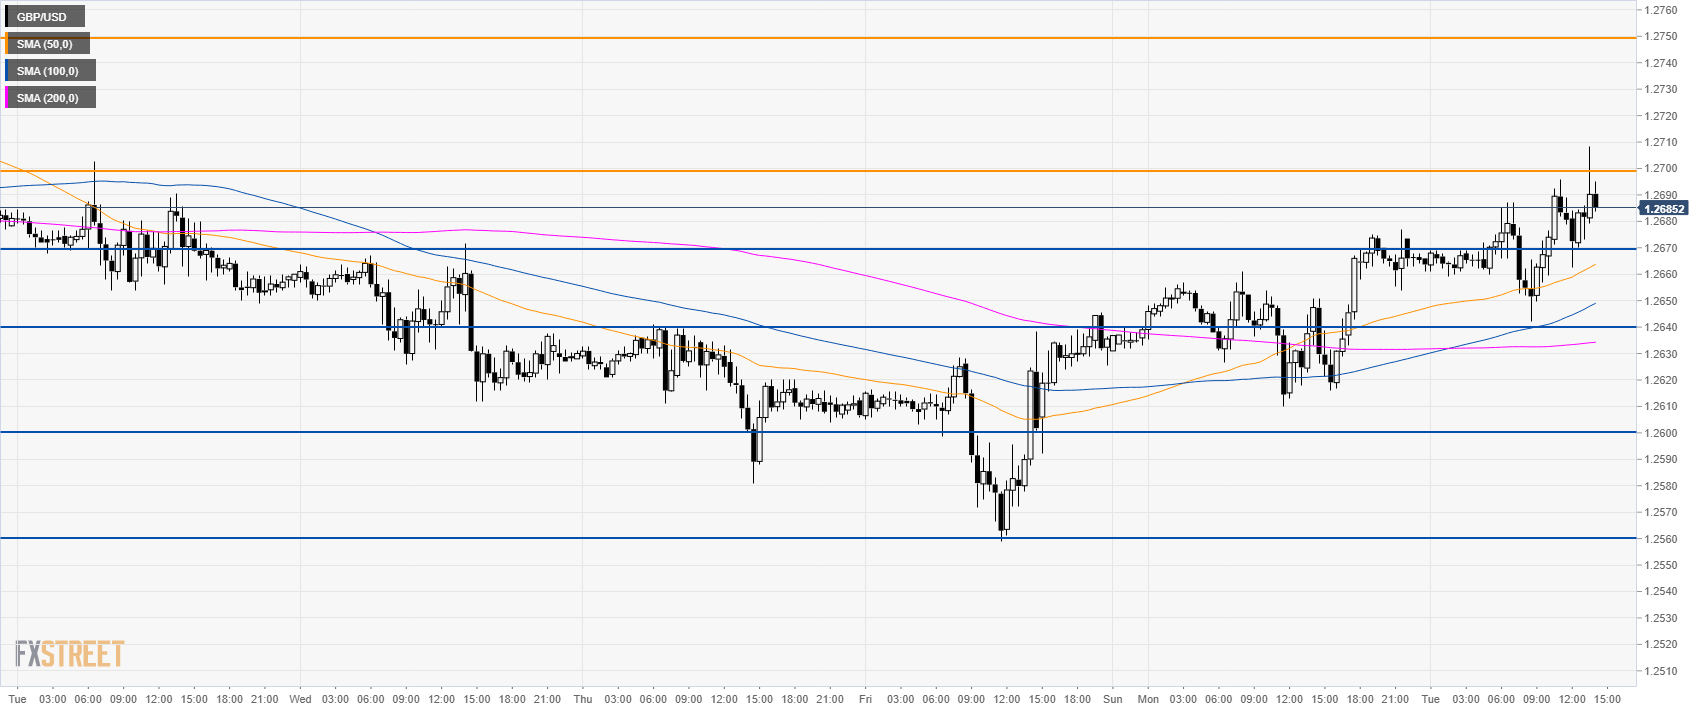
GBP/USD 30-minute chart
GBP/USD bulls need to keep the market above 1.2700 key resistance. A sustained break above the level can lead to 1.2750. Support is seen at 1.2670 and 1.2640.
Additional key levels
