- The market is starting to price in a rate cut which is seen as bullish for stocks.
- China’s Commerce Ministry said he was open to dialogue between the US and China, somehow alleviating some tensions in the trade war.
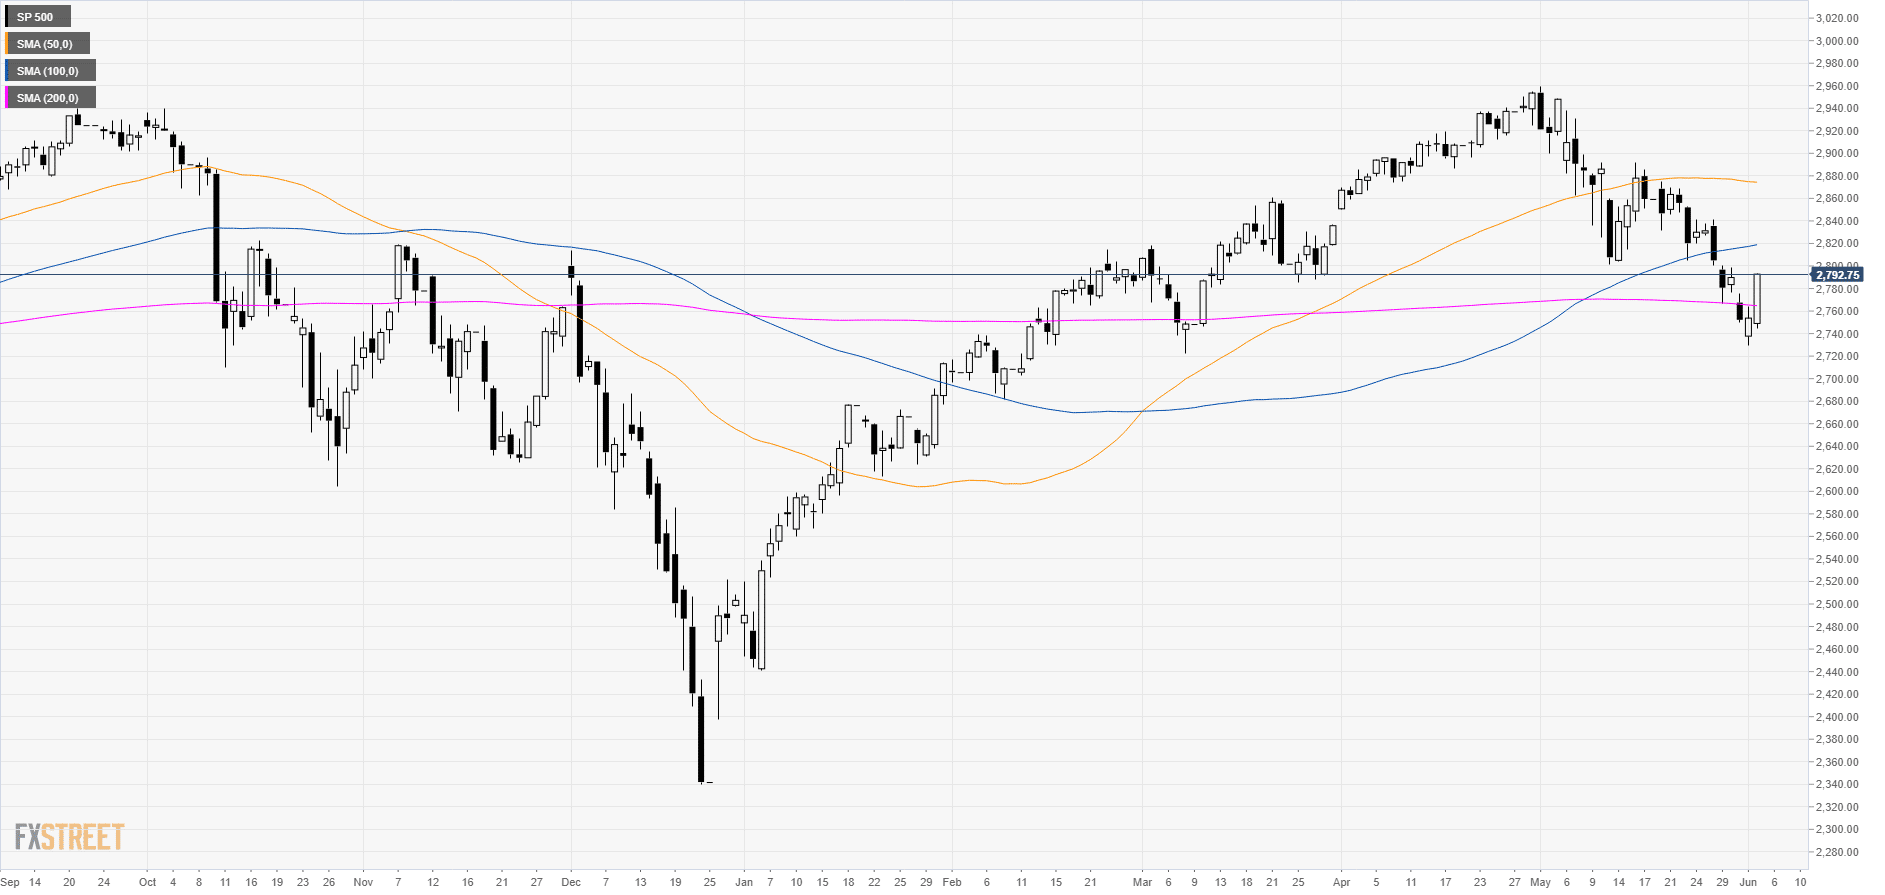
S&P500 daily chart
The S&P500 Index is having a boost this Tuesday as the market trades above the 200-day simple moving average (DSMA).
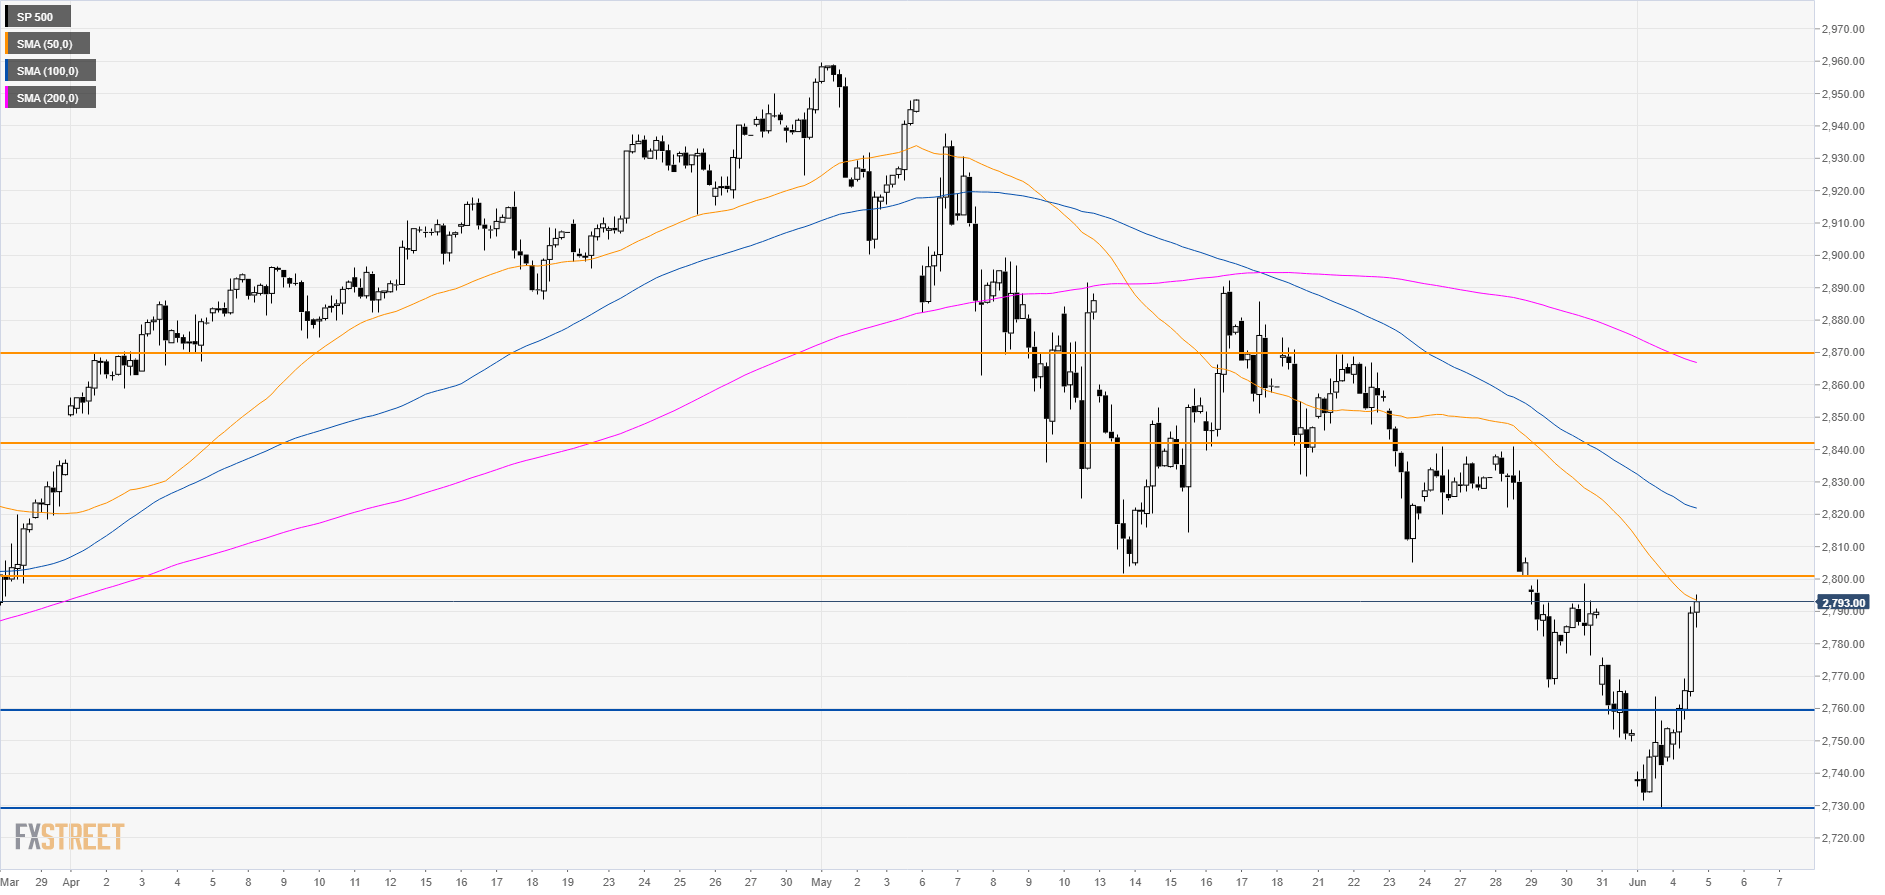
S&P500 4-hour chart
The index is challenging the 2800.00 mark and the 50 SMA. If the bulls manage to break that level, 2840.00 and 2870.00 can become bull targets. Support is at 2,760.00 and 2,730.00.
Additional key levels
