- USD/CHF remain under pressure below 0.9980.
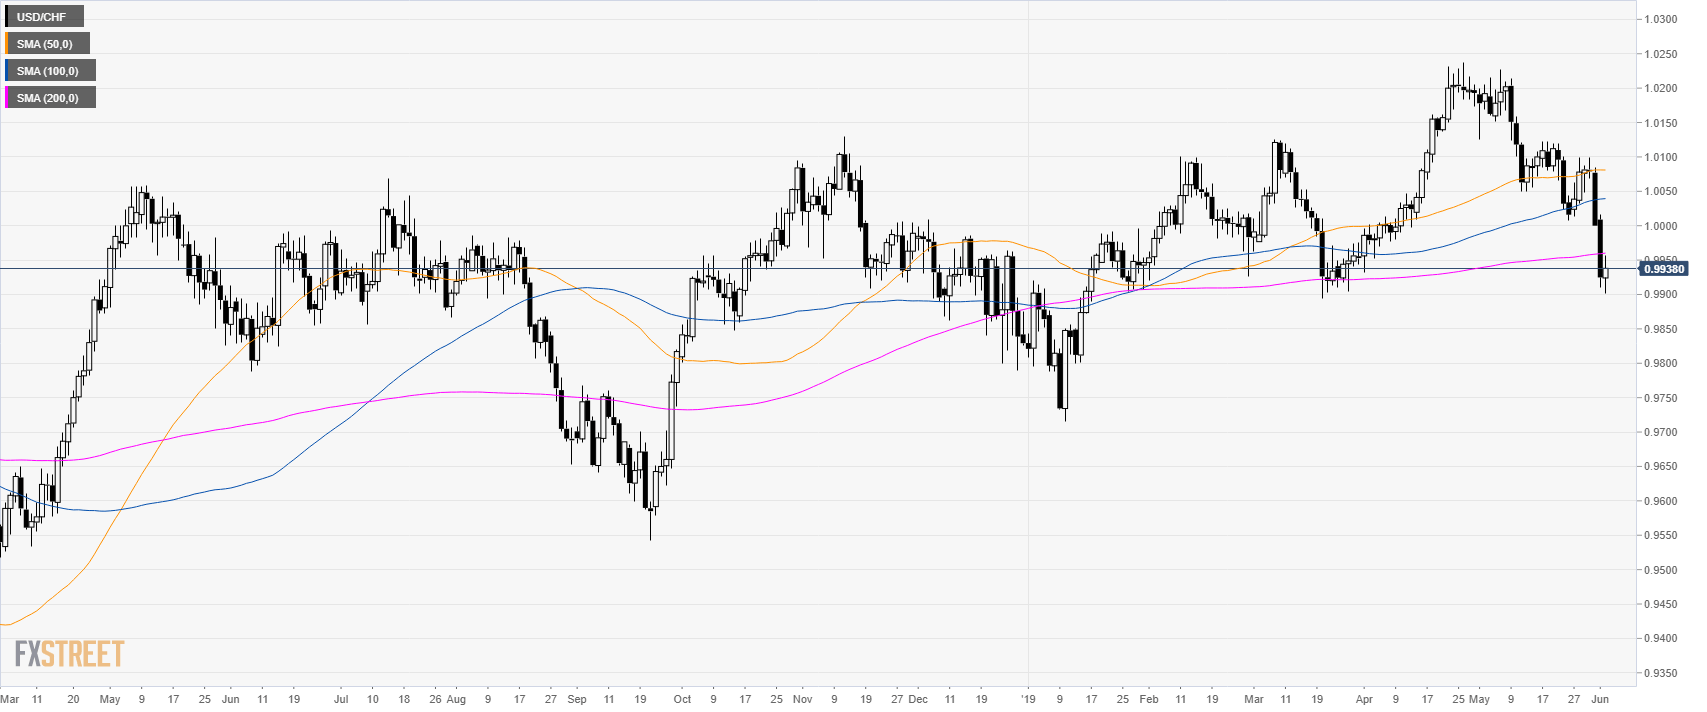
- USD/CHF is trading below its 200 DSMA.
USD/CHF daily chart
USD/CHF is trading below the parity level and its main daily simple moving averages (DSMAs).
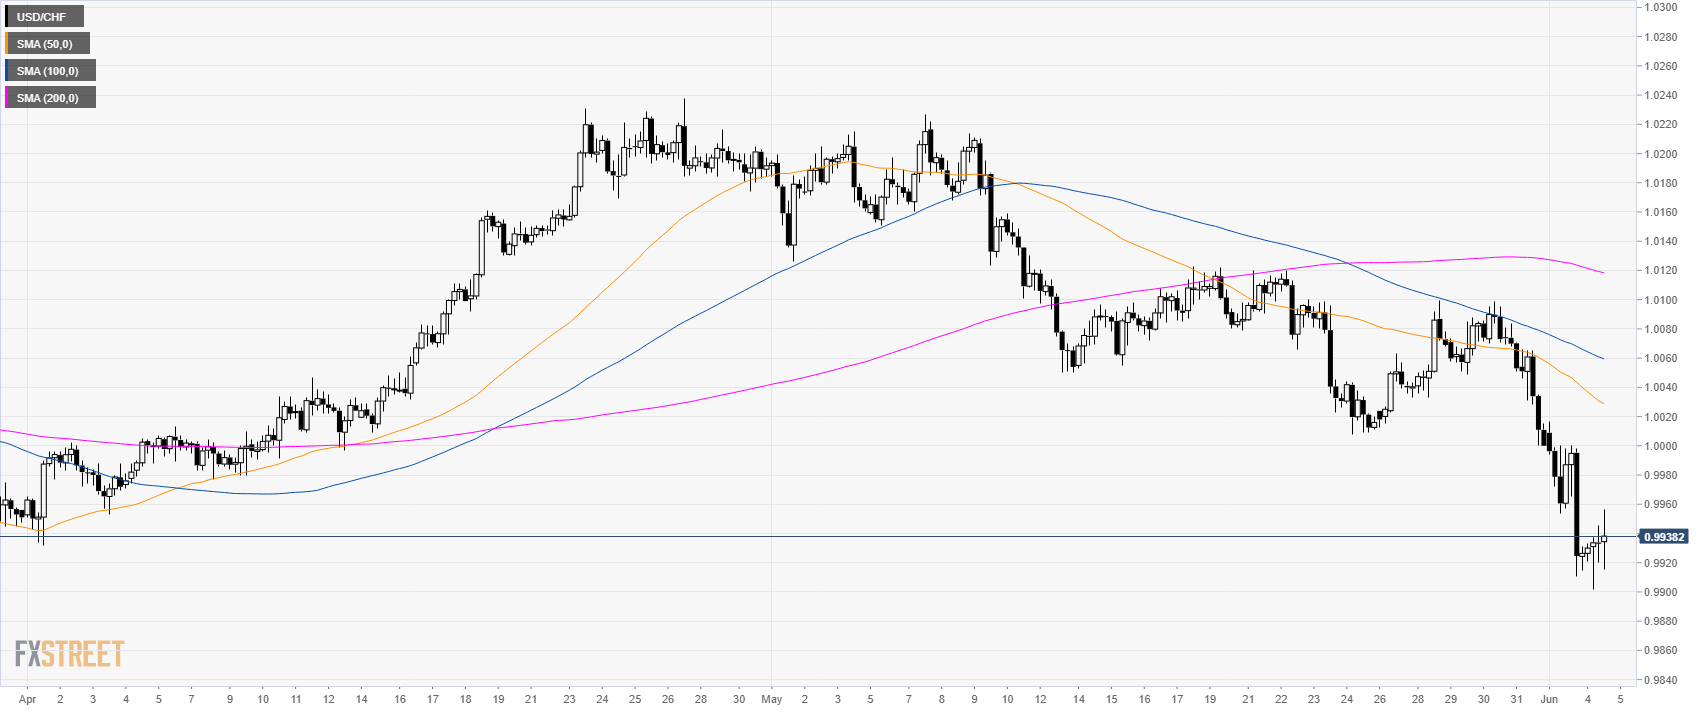
USD/CHF 4-hour chart
USD/CHF is trading below its main SMAs suggesting a bearish bias.
USD/CHF 30-minute chart
The market is trading below the 100 and 200 SMAs suggesting a bearish bias in the near term. A break below 0.9990 can lead to 0.9860 and 0.9800 to the downside. Resistances are seen at 0.9980 and 1.0040.
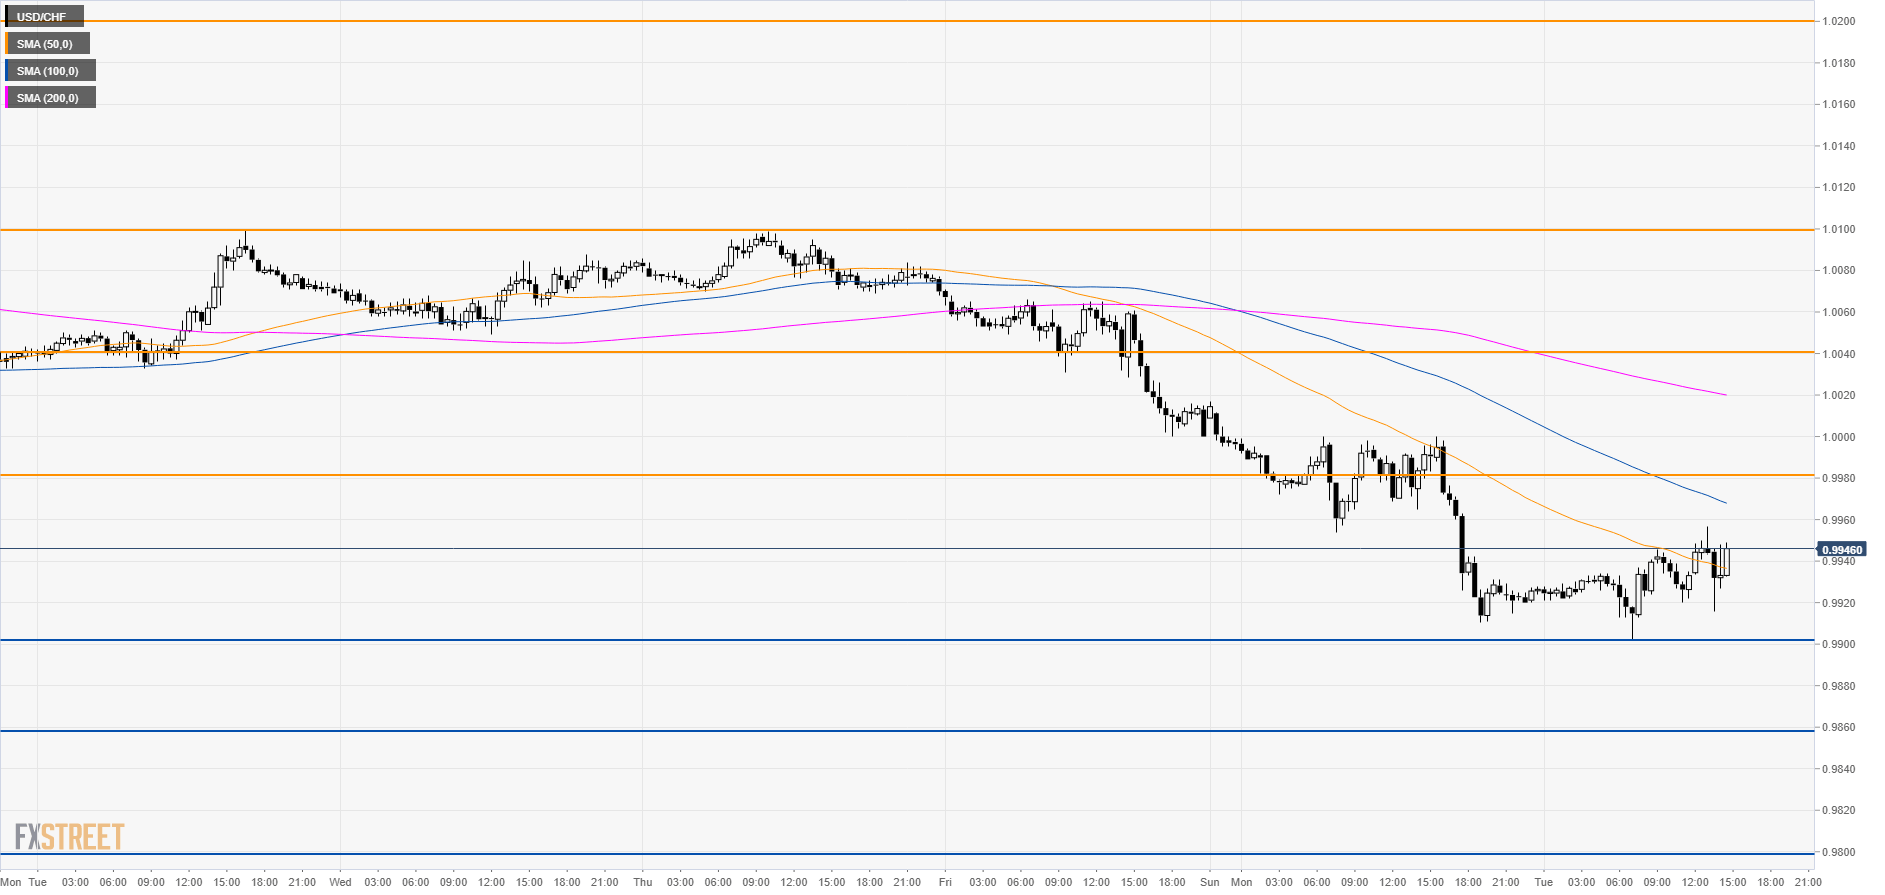
Additional key levels
