- 50-day SMA becomes additional resistance than 61.8% Fibo. and 200-day SMA.
- Four-month-old support-line flashes on sellers’ radar.
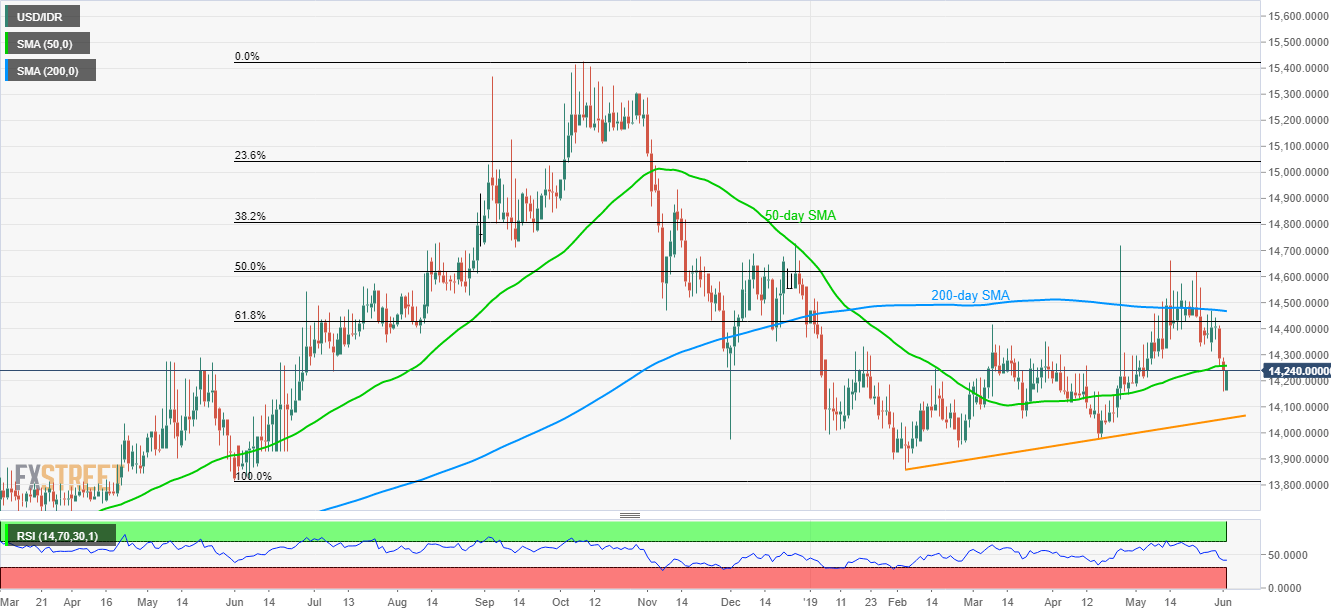
Latest buyers of the USD/IDR pair may find it tough to prevail for long as 50-day SMA can limit immediate upside as the quote is on the bids near 14,240 during early Tuesday.
Prices have to clear 50-day simple moving average (SMA) level around 14,260 in order to extend present pullback moves towards 14,340 and 61.8% Fibonacci retracement of June to October 2018 upside surrounding 14,435.
It should also be noted that 200-day SMA level of 14,467 and 50% Fibonacci retracement near 14,620 could try limiting the north-run past-14,435.
Meanwhile, pair’s dip beneath the latest low of 14,157 highlights the importance of four-month-old ascending trend-line at 14,055 now as a break of which can further fetch the quote down in the direction to April month lows near 13,970.
During the bear’s dominance below April’s bottom, February trough near 13,860 and June 2018 low near 13,815 should be in the spotlight.
USD/IDR daily chart
Trend: Bearish
