- Sustained trading beyond 200-HMA portrays underlying strength in momentum ahead of Aussie GDP.
- Two-week-old resistance-line can question buyers.
Despite repeated failures to clear 75.70, the AUD/JPY pair successfully trades above 200-HMA as it ticks near 75.65 during the early Asian session on Wednesday.
With this, chances of the quote’s run up to 61.8% Fibonacci retracement of late-May to the early-June downturn, at 75.85, can’t be denied.
However, two-week-old descending trend-line at 76.05 might confine the pair’s rise past-75.85, if not then 76.35 may lure buyers.
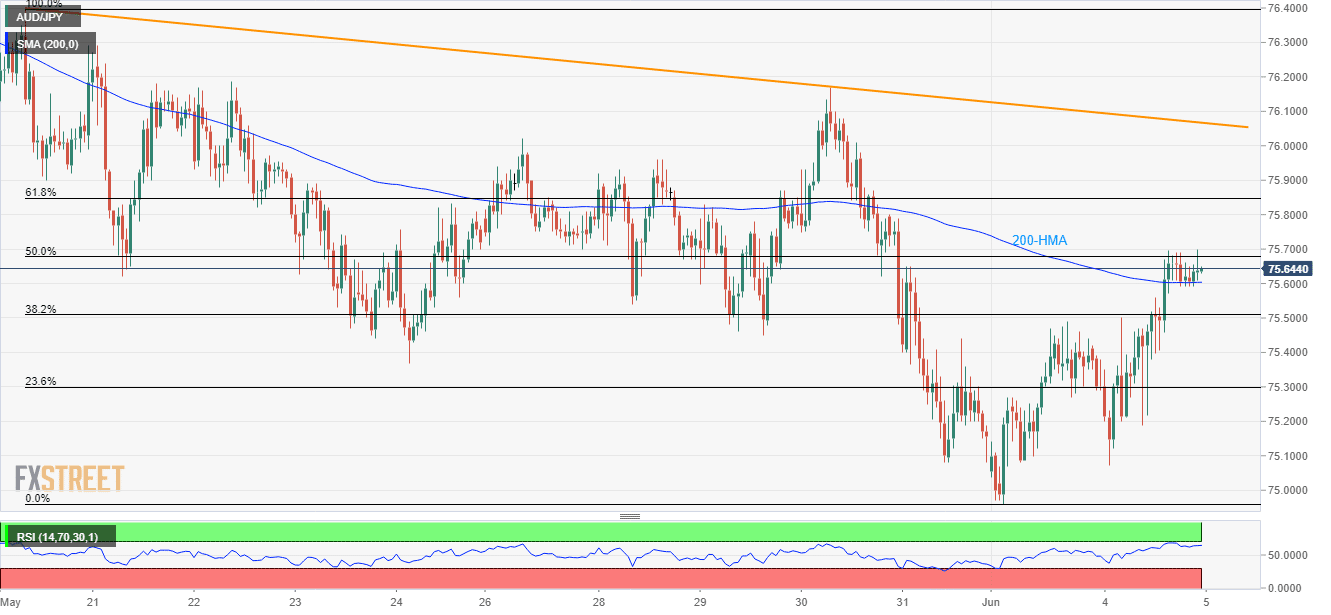
Alternatively, a downside break of 75.60 figure comprising 200-hour moving average (HMA) can trigger fresh declines to 75.50, 75.30 and then to 75.00.
Should there be an additional weakness in the pair’s trade sentiment below 75.00, the July 2016 low near 74.50 may become sellers’ favorite.
AUD/JPY hourly chart
Trend: Bullish
