- NZD/USD witnessed a falling wedge breakout last week.
- The bearish-to-bullish trend change is backed by bullish mmommentum studies.
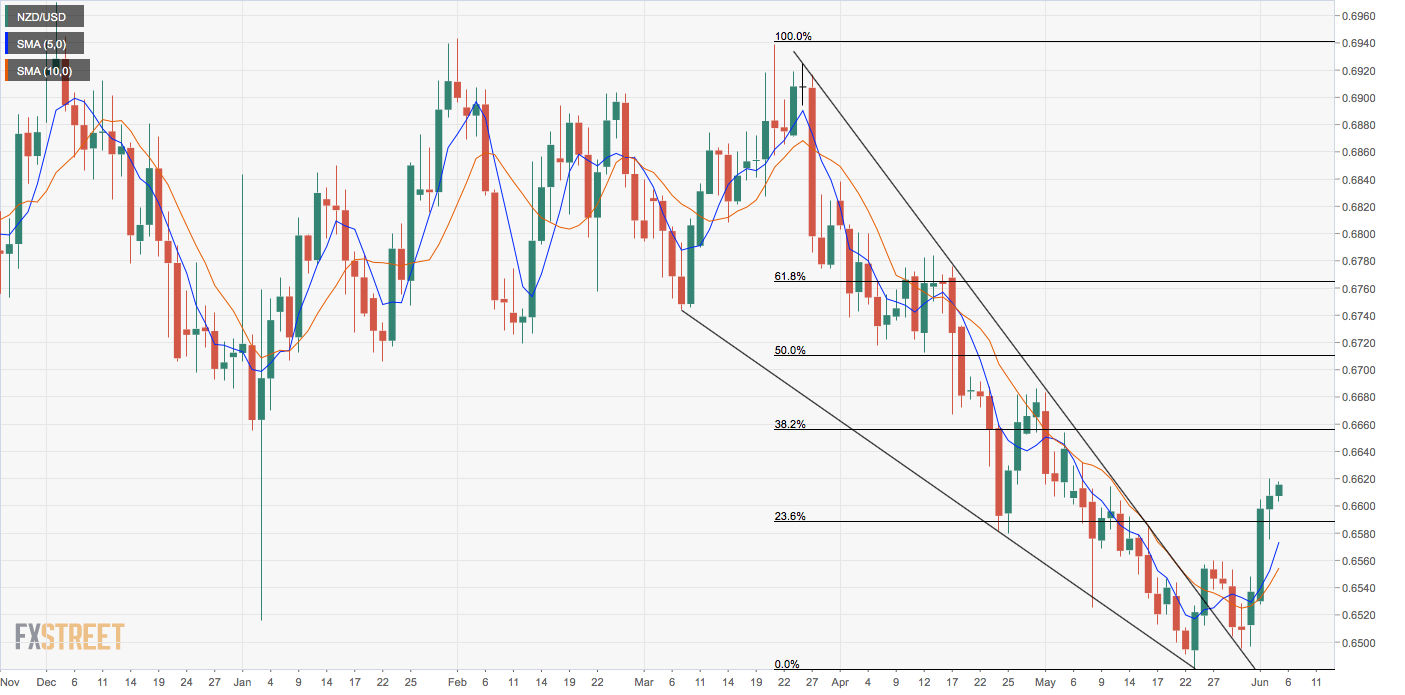
NZD/USD is currently trading at 0.6614, representing 0.15% gains on the day and could test supply around the 50-day moving average (MA), currently at 0.6640, in the next few hours.
The currency pair has found acceptance above 0.6589 (23.6% Fib R of 0.6938-0.6482) this week, having confirmed a falling wedge breakout – a bearish-to-bullish trend change – on May 24.
The 5- and 10-day moving averages (MAs) are trending north, indicating a bullish setup. Further, the 14-day relative strength index is currently reporting bullish conditions with an above-50 print.
The path of least resistance, therefore, is on the higher side. A daily close above the 50-day MA of 0.6640 would further strengthen the bullish bias and expose the next resistance at 0.680-0.61.
The bullish outlook would weaken if the spot finds acceptance below the former resistance-turned-support of 0.6659.
Daily chart
Trend: Bullish
Pivot points
