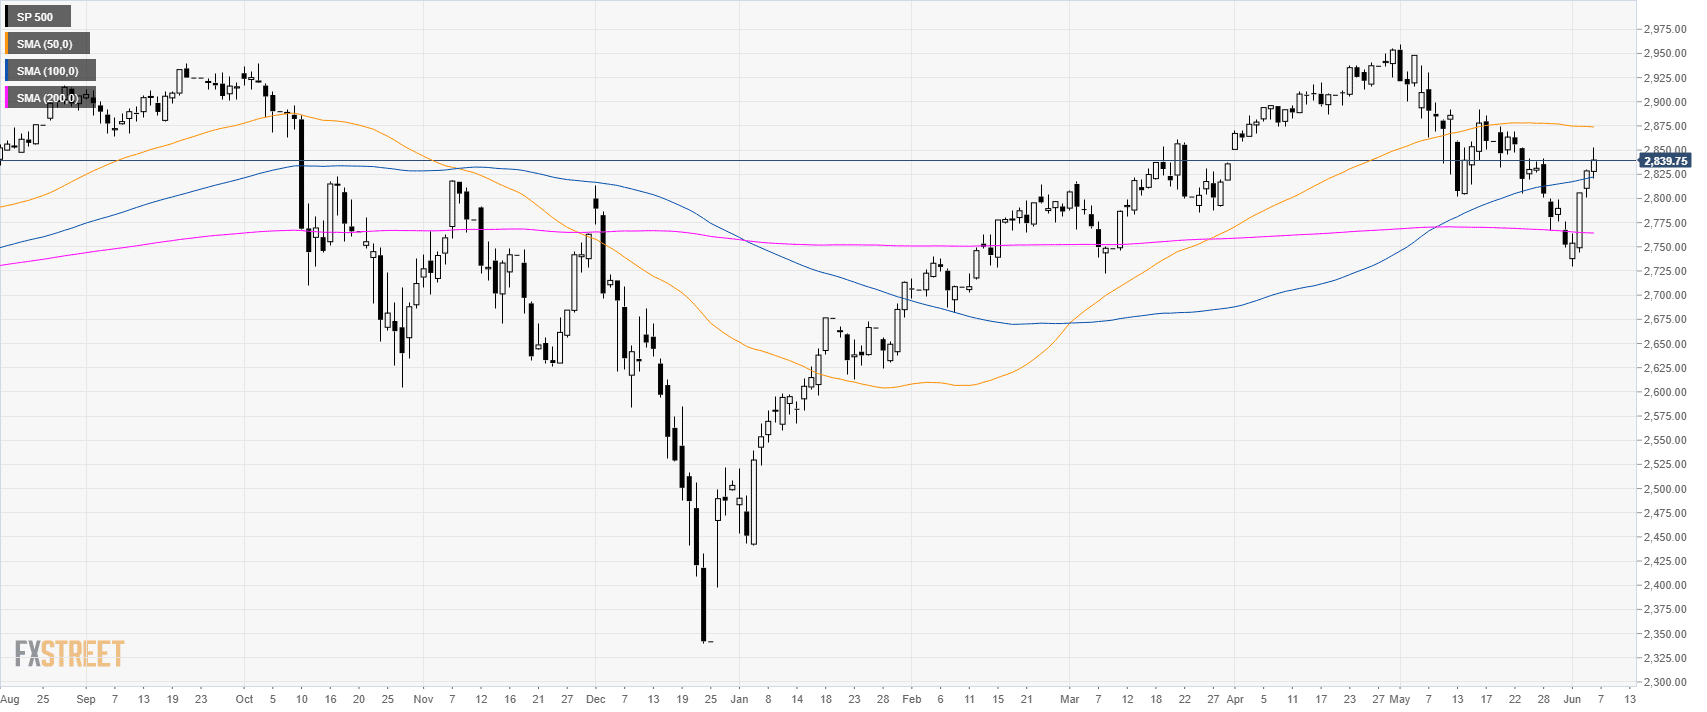
S&P500 daily chart
The S&P500 Index is up for the fourth consecutive day this Thursday as the market trades above the 100 and 200-day simple moving average (DSMA).
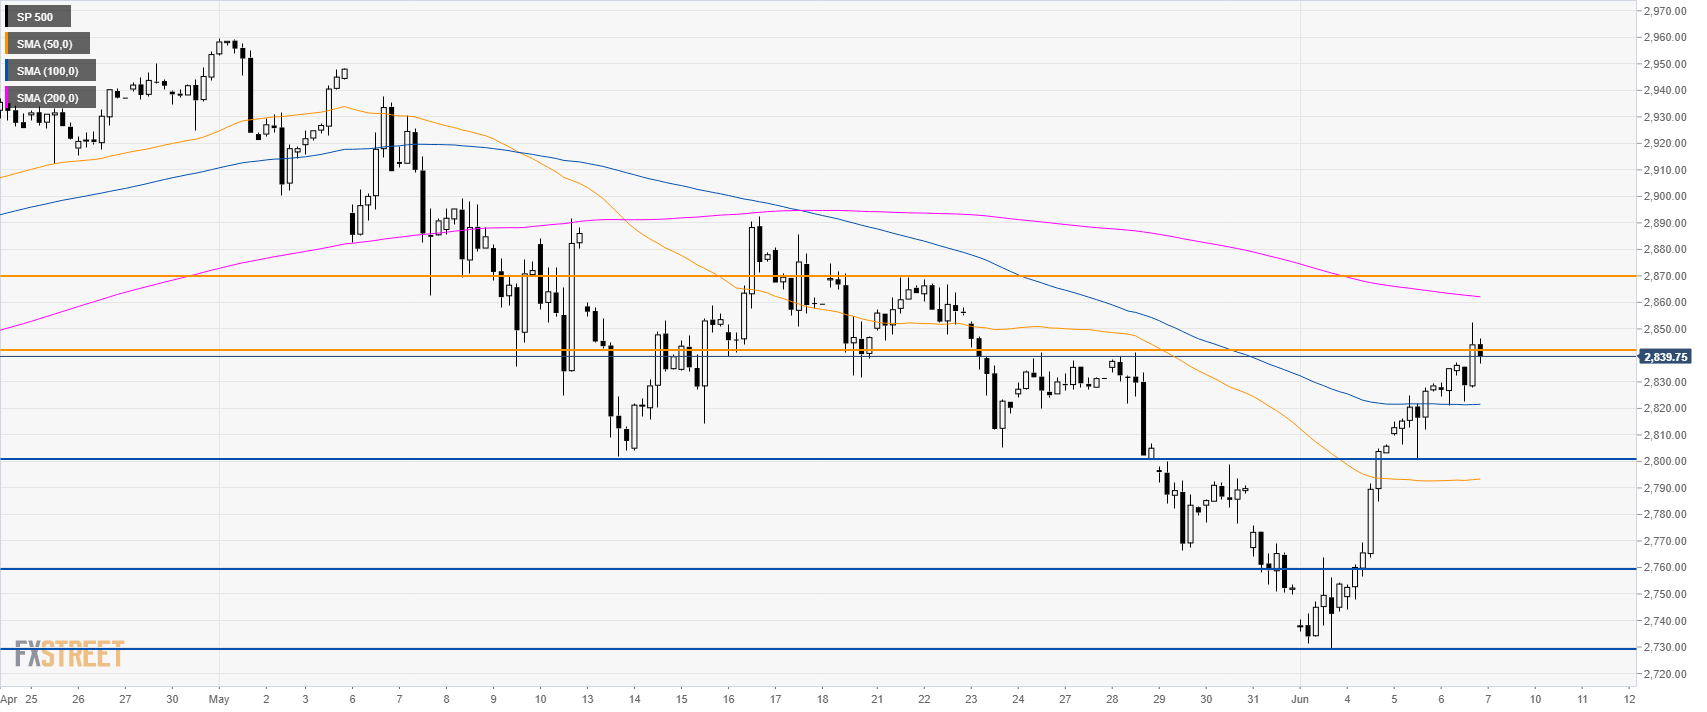
S&P500 4-hour chart
The index is trading above the 2,800.00 mark and the 50/100 SMAs. The 2,840.00 target has been hit while 2,870.00 remain on the bulls radar. Support is at 2,800.00; 2,760.00 and 2,730.00.
Additional key levels
