- 100-HMA, immediate trend-line question short-term sellers.
- Upside remains capped by 10-day long horizontal region.
Despite failures to cross 10-day long horizontal resistance, GBP/USD refrained from slipping beneath 1.2685/80 support-confluence as it clings to 1.2695 ahead of the UK open on Friday.
The said support-joint comprising 100-hour moving average (HMA) and an upward sloping trend-line stretched since Monday.
In a case where sellers drag the quote under 1.2680, 1.2640 and 1.2600 are likely following numbers to appear on the chart.
Additionally, the latest low surrounding 1.2560 can please bears past-1.2600.
Meanwhile, 61.8% Fibonacci retracement of the recent downturn, at 1.2720 now, may limit the pair’s adjacent advances, a break of which highlights 1.2740/50 horizontal resistance-area.
If at all bulls manage to conquer 1.2750, 1.2800 and 1.2815 might flash on their radar.
GBP/USD hourly chart
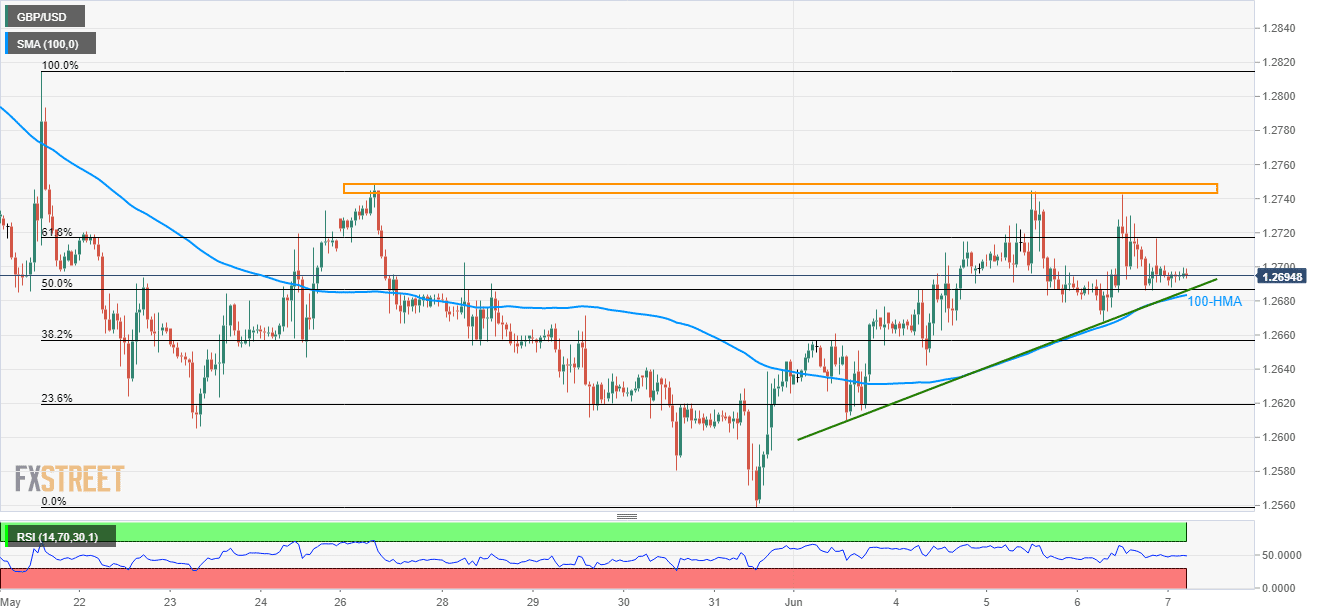
Trend: Sideways to positive
