- Trades beneath 50-HMA to revisit near-term horizontal support.
- 200-HMA can restrict additional downside.
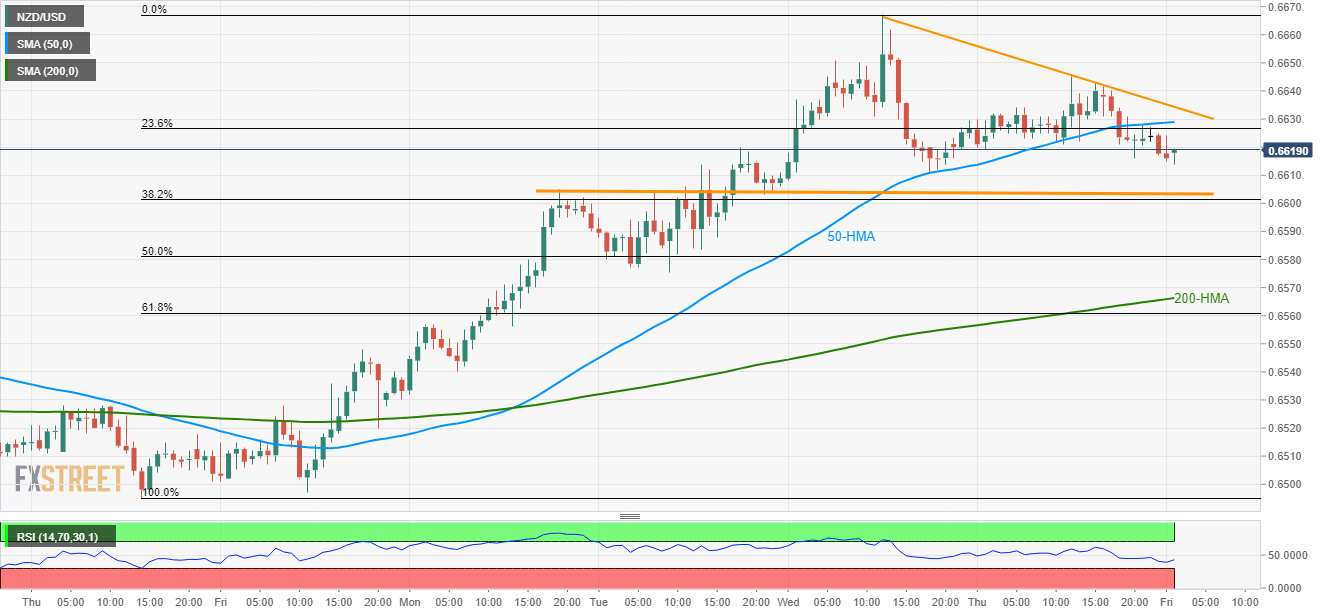
In addition to immediate descending trend-line, slip beneath 50-HMA also portrays the NZD/USD pair’s weakness while it trades near 0.6616 on early Friday.
The horizontal-line connecting current week’s high/low seems immediate support for the pair at 0.6600, a break of which can trigger fresh selling towards 50% Fibonacci retracement level of 0.6580.
However, 200-hour moving average (HMA) can restrict the quote’s further declines at 0.6565, if not then 0.6530 is likely next target for the bears.
Alternatively, 50-HMA level around 0.6630, adjacent to downward sloping trend-line at 0.6635, may confine the pair’s short-term upside.
Should there be a break of 0.6635, 0.6650, 0.6670 and 0.6700 may entertain buyers.
NZD/USD hourly chart
Trend: Bearish
