- The lower-than-expected US Nonfarm Payrolls (NFP) increases expectations of a Fed’s rate cut, sending equities up.
- Easing tensions on the trade war front alos helped equities. Chinese President Xi said that a solution should be found despite the disagreements.
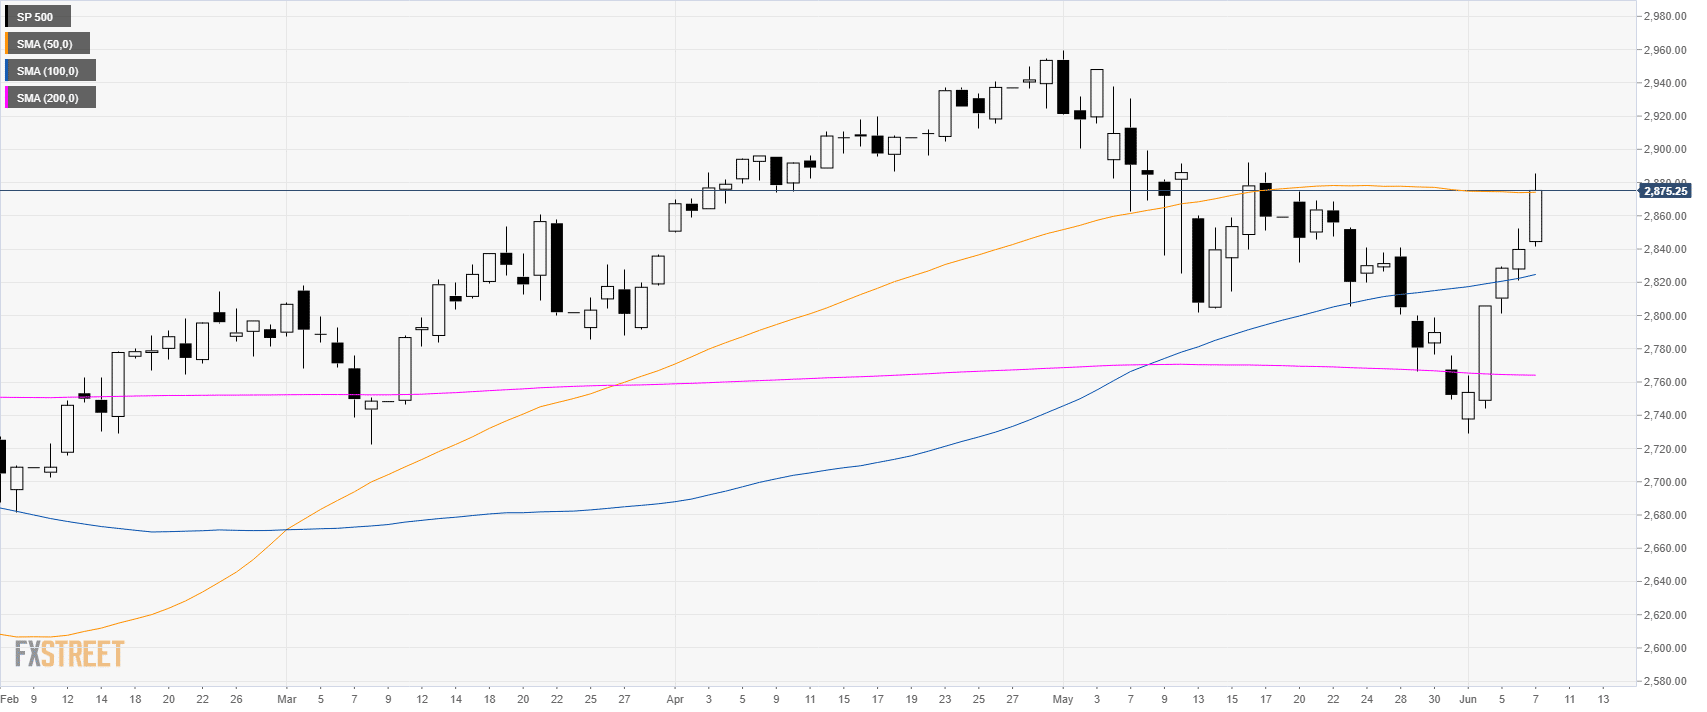
S&P500 daily chart
The S&P500 Index is up for the fifth consecutive day this Friday as the market is testing the 200-day simple moving average (DSMA).
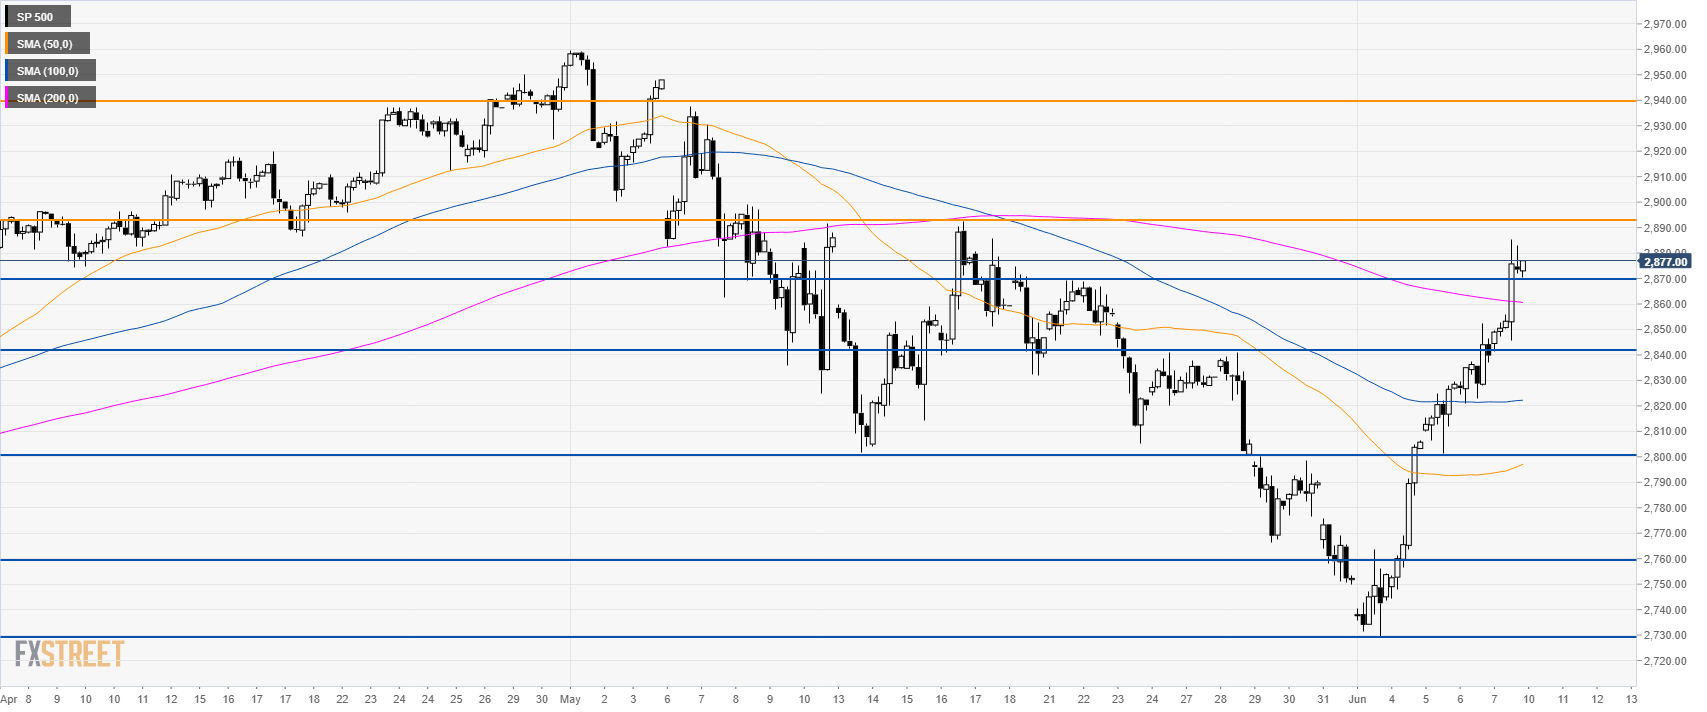
S&P500 4-hour chart
The index is under bullish pressure above its main SMAs. The 2,870.00 target has been hit while 2,893.00 and 2,940.00 are now on the bulls radar. Immediate support is at 2,8700.00 and 2,800.00.
Additional key levels
