- 100-day SMA restricts immediate declines.
- 61.8% Fibonacci retracement and 200-day SMA can also question buyers during the past-14,291 break.
Despite being positive beyond 100-day SMA, USD/IDR lacks upside momentum as 50% Fibonacci retracement limits the quote’s strength as it takes the rounds near 14,262 during early Friday.
As a result, the pair’s downside break of 100-day simple moving average (SMA) level of 14,187 can trigger its fresh bout of selling towards four-month-old ascending trend-line at 14,067/66.
Should bears refrain from respecting 14,066, 14,000 and April month bottom near 13,974 may offer intermediate halt ahead of challenging current year bottom around 13,858.
On the contrary, a clear rise above 50% Fibonacci retracement of December 2018 to February 2019 declines, at 14,291 can activate the pair’s new buying phase in the direction to 14,330 and 61.8% Fibonacci retracement level of 14,394.
However, 200-day SMA level of 14,461 could question the quote’s further upside past-14,394, if not then May month high around 14,661 might flash on bulls’ radar.
USD/IDR daily chart
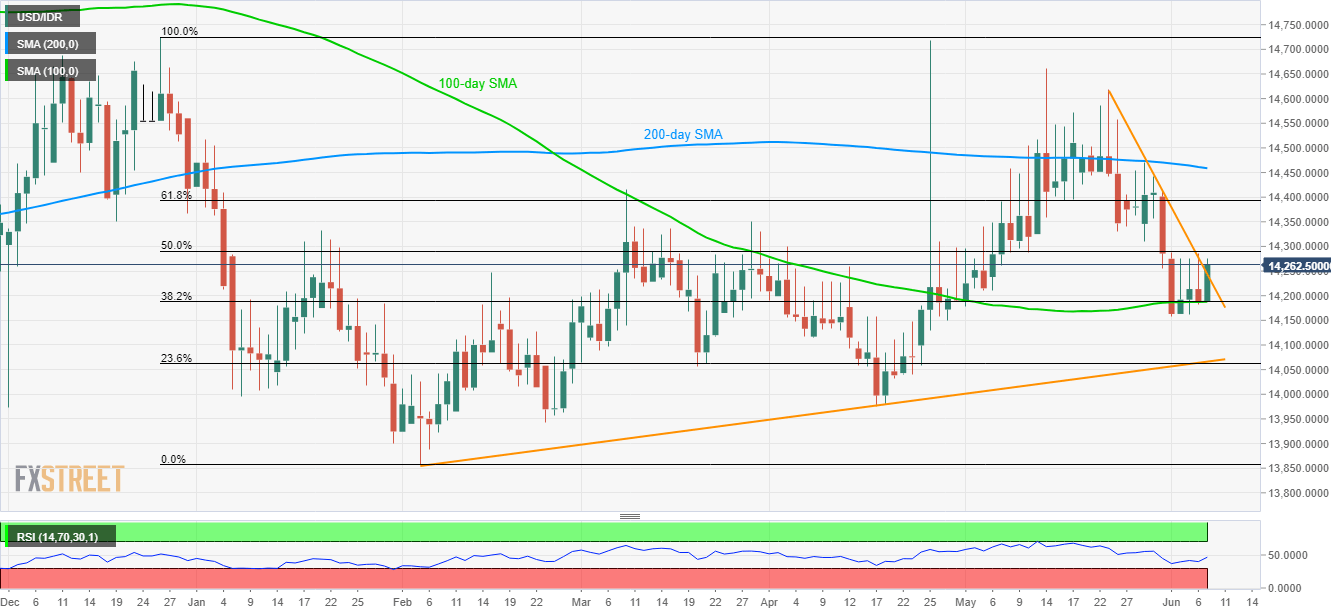
Trend: Pullback expected
