- Bearish formation underplays ahead of today’s US NFP data.
- 200-HMA offers additional upside resistance.
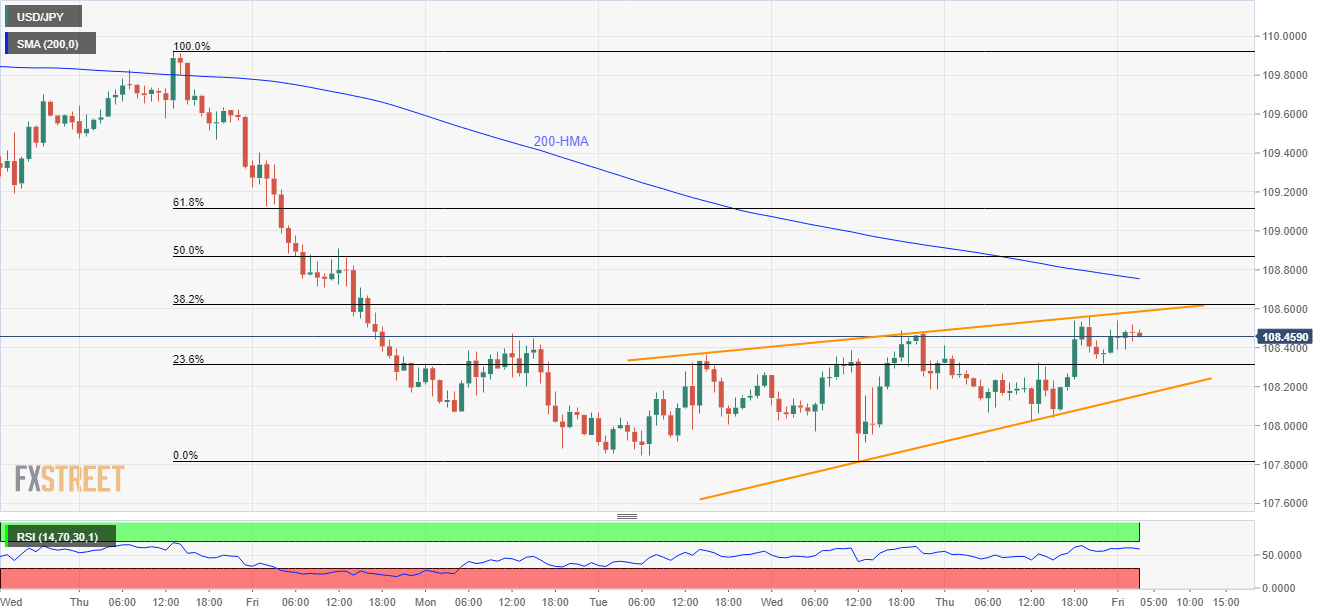
A three-day-old rising wedge formation seems to limit the USD/JPY pair’s upside as it trades near 108.48 during early Friday.
The formation now portrays 108.60 as resistance and 108.15 as a support-line, which in turns means the quote is funneling down towards the breakout points.
On the upside, 200-hour moving average (HMA) level of 108.75 can become an additional resistance past-108.60, a break of which can propel prices to 109.00 and 109.35/40 area.
Meanwhile, 108.30 can offer immediate support to the pair ahead of dragging it back to pattern’s lower line of 108.15.
In a case where prices slip beneath 108.15, the bearish formation gets confirmed and may activate the pair’s downpour in the direction to 107.50 (theoretically) with 107.80 being an intermediate halt.
USD/JPY hourly chart
Trend: Pullback expected
