- Failure to cross 21-day SMA portrays the pair’s weakness.
- 75.00, 61.8% Fibo. can entertain sellers.
- RSI questions heavy downpour.
Inability to hold the uptick beyond 21-day SMA presently drags the AUD/JPY pair to 75.47 during the early Asian session on Tuesday.
While January 04 low near 75.24 seem immediate support to watch, the latest bottom surrounding 75.00 and 61.8% Fibonacci retracement level of January – April upside, at 74.52, gain more popularity among sellers.
However, the weak position of the 14-day relative strength index (RSI) may question pair’s heavy downturn, if not then the year 2016 bottom near 72.40 could become bears’ favorite.
Alternatively, a confluence of the 21-day simple moving average (SMA) and 50% Fibonacci retracement level around 75.70 seems to limit the quote’s short-term upside, a break of which can recall 76.20 and 76.40 on the chart.
In a case where prices rally past-76.40, 77.00 and 50-day SMA level of 77.50 may mark their presence.
AUD/JPY daily chart
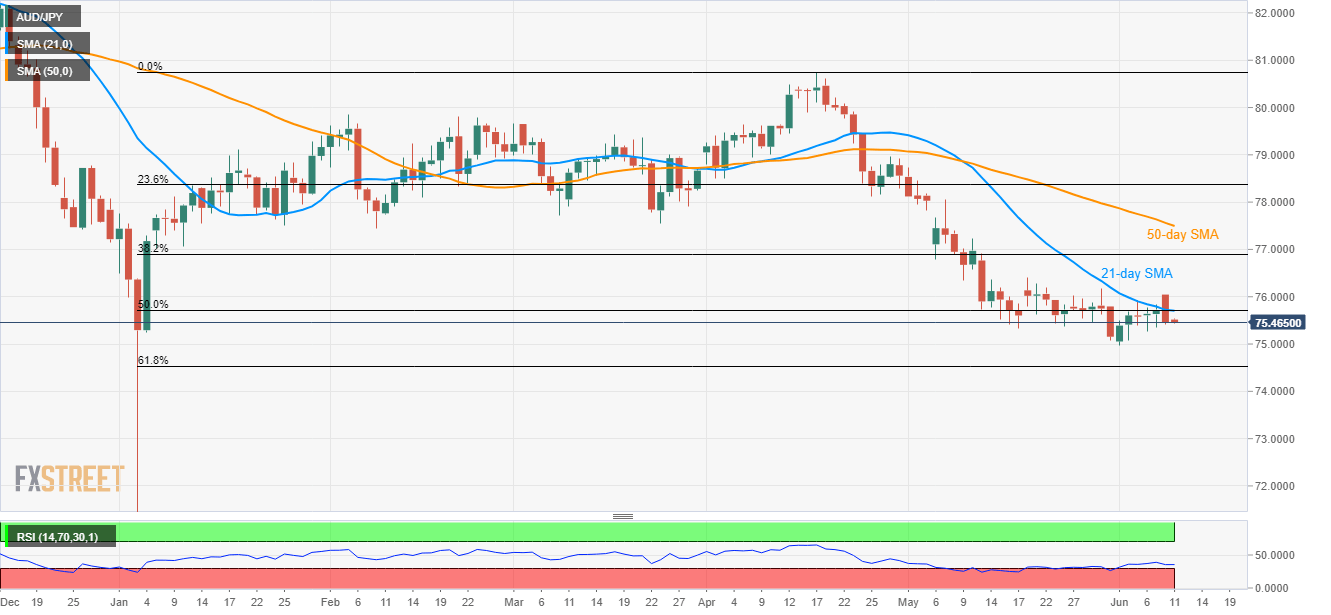
Trend: Bearish
