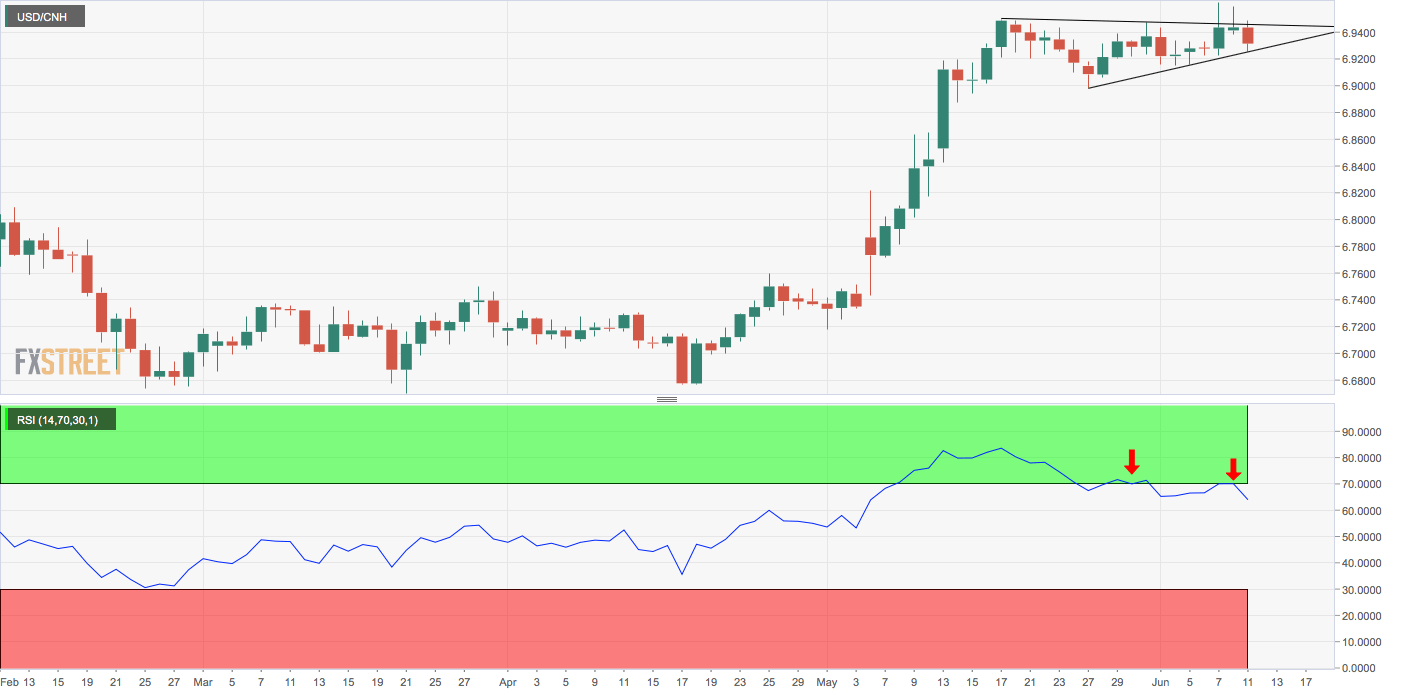
- The USD/CNH pair has created a pennant pattern on the daily chart.
- The daily RSI favors downside break of the consolidation pattern.
The USD/CNH pair is bein squeezed in a narrowing price range with a key indicator calling a downside break.
The currency pair seems to have created a pennnat patternn – a continnuation setup that often ends up accelerating the preceding bullish mmove. So, a break above the upper edge of the pennant, currently at 6..9482, could be followed by a move above 7.00. It is worth noting that Goldman Sachs sees China’s Yuan falling beyond 7 per US Dollar in three months.
The 14–day relative strenght index (RSI), however, is in favor of a downside break of the pennant pattern. The indicator has recently created lower highs as opposed to higher highs on the price chart. That bearish divergence is widely considered an early warning of a potential trend change.
A pennant breakdown, if confirmed with a close below 6.9247, would open the doors to 6.8527, which is the 38.2% Fibonacci retracement of the rally from 6.6757 to 6.9618.
Daily chart
Trend: Bullish
Pivot points
