- Downside confined by 10-day long ascending trend-line and 4H 100MA.
- An upside break of 1.2760/65 becomes necessary to lure buyers.
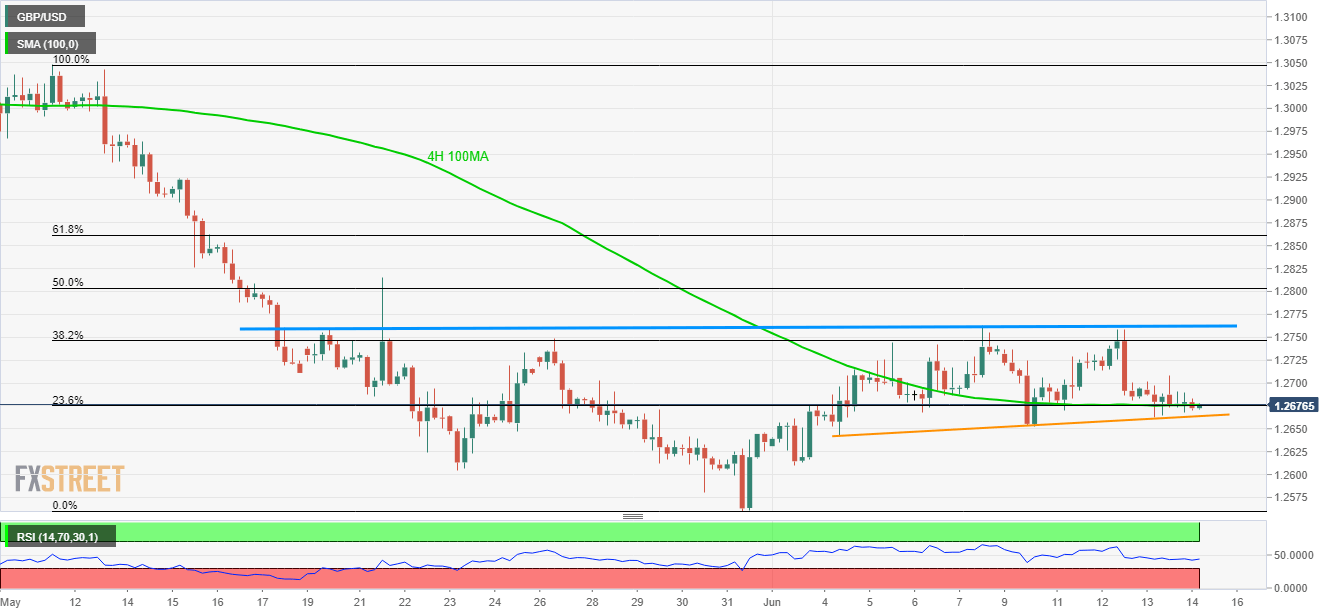
GBP/USD remains modestly flat around 100-bar moving average (4H 100MA) and 10-day long support-line as it trades near 1.2675 while heading into the UK open on Friday.
A downside break of 1.2660 trend-line can trigger selling pressure towards 1.2600 and the latest lows surrounding 1.2560.
In a case where prices keep trading beneath 1.2560, December 2018 lows near 1.2480 and the year 2019 bottom around 1.2430 can flash on the bear’s radar.
During the pair’s U-turn, 1.2715 may act as the closest resistance ahead of highlighting the 1.2760/65 horizontal area comprising multiple highs since mid-May.
If the quote rallies past-1.2765, 1.2830 and 61.8% Fibonacci retracement near 1.2860 may offer stops to its north-run targeting a cross of 1.2900 round-figure.
GBP/USD 4-Hour chart
Trend: Sideways
