- Failure to successfully cross the key resistance triggered the pair’s pullback from the month’s high.
- 61.8% Fibonacci retracement and two-month-old support-line are on the sellers’ radar.
Failure to hold the break of 4H 200MA and 50% Fibonacci retracement propelled, presently pulls the USD/IDR pair towards 61.8% Fibonacci retracement as the quote is taking the rounds to 14,280 during initial Friday.
Should prices slide beneath 61.8% Fibonacci retracement of its April month upside near 14,260, an ascending trend-line stretched since mid-April at 14,198 seems the key support to watch.
In a case where the pair drops under 14,198, current month low surrounding 14,155, 14,050 and 14,000 could become bears’ favorites.
On the contrary, 50% Fibonacci retracement and 200-bar moving average (4H 200MA), near 14,345, seems a tough upside resistance as sustained trading beyond the same can propel prices to multiple highs marked by the end of May 30 surrounding 14,410 and then to 38.2% Fibonacci retracement at 14,434.
If buyers ignore overbought levels of 14-bar relative strength index (RSI) and fuel prices beyond 14,434, 14,475 and a month-long descending trend-line near 14,525 could flash on their radar.
USD/IDR 4-Hour chart
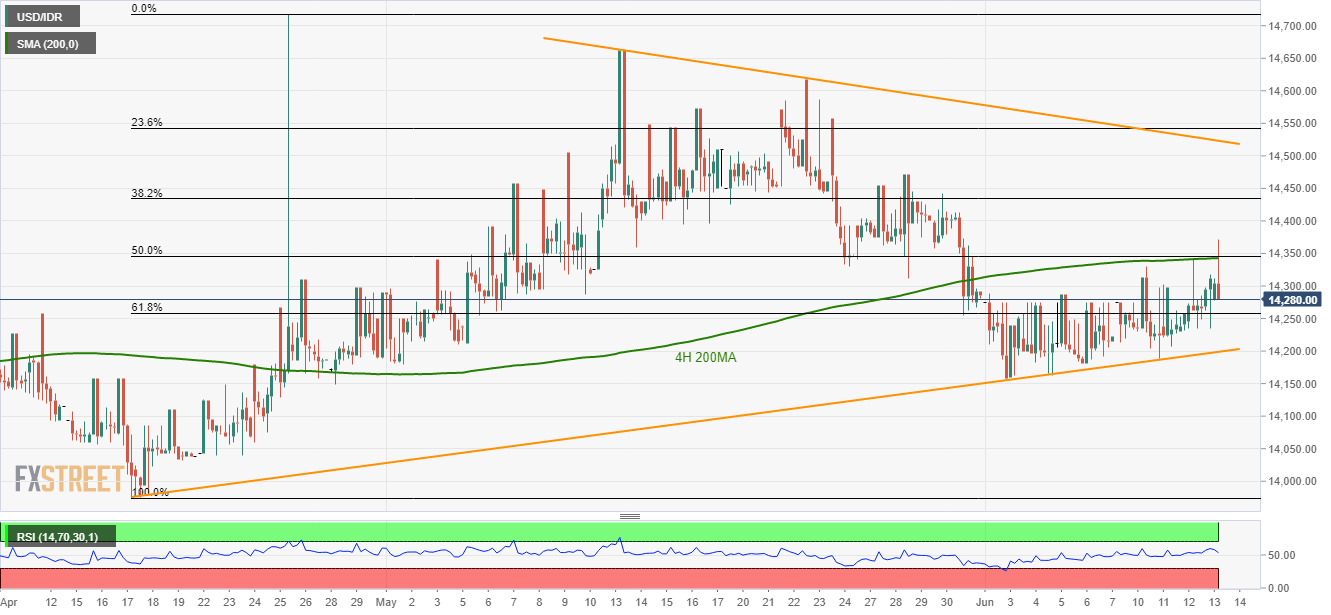
Trend: Pullback expected
