- A descending channel from May-start and a 3-week old trend-line resistance limit immediate advances.
- 107.80 and 107.30 seem the key supports.
While a downward sloping trend channel aptly portrays the USD/JPY pair’s decline since early May, the latest pullback from 23.6% Fibonacci retracement drags it towards 108.32 during early Friday.
The pair can avail 108.00 and current month low near 107.80 as intermediate halts prior to extending the south-run to the channel support of 107.30.
Should there be additional weakness past-107.30, multiple supports around 107.00 and early-April 2018 lows near 106.60 can entertain sellers.
During the uptick, 23.6% Fibonacci retracement of May – June decline, at 108.72, offers immediate resistance to the pair ahead of fueling it to 3-week old trend-line resistance of 108.80.
However, the quote’s rise beyond 108.80 will be challenged by the channel’s upper line of 109.25 and then 200-bar moving average (4H 200MA) 109.55.
USD/JPY 4-Hour chart
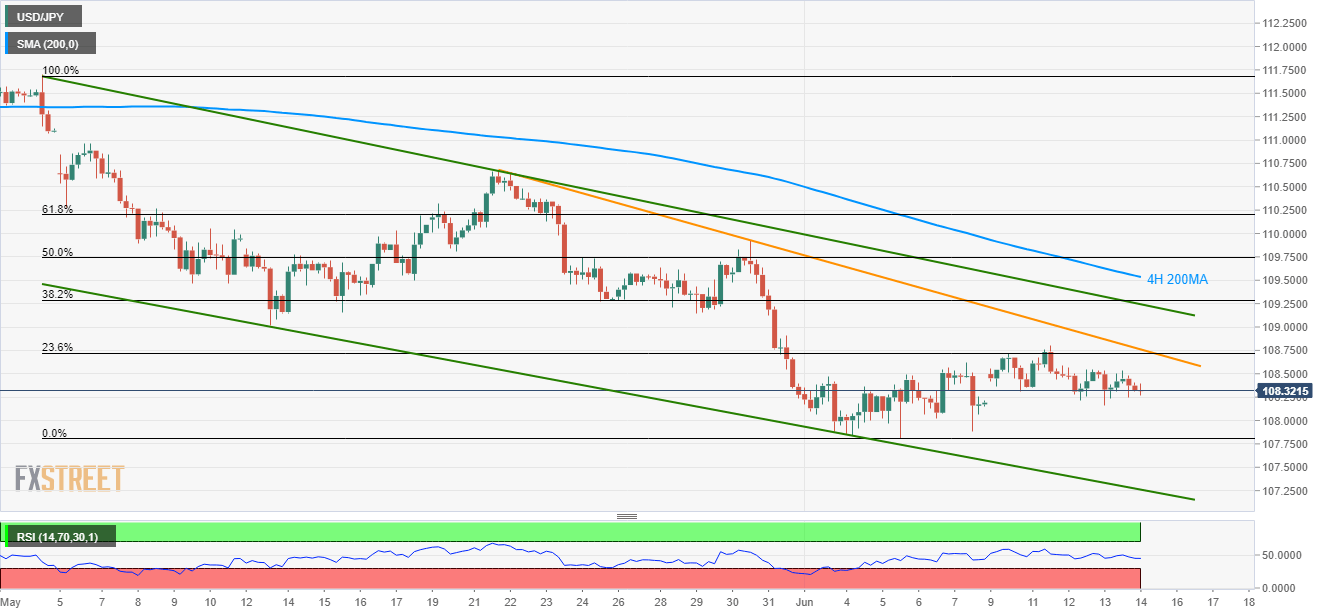
Trend: Bearish
