- Oil is trading back and forth near $52.50 a barrel.
- The market remains under selling pressure although it is attempting to stabilize above 51.00.
- A break above 53.60 would be seen as quite bullish.
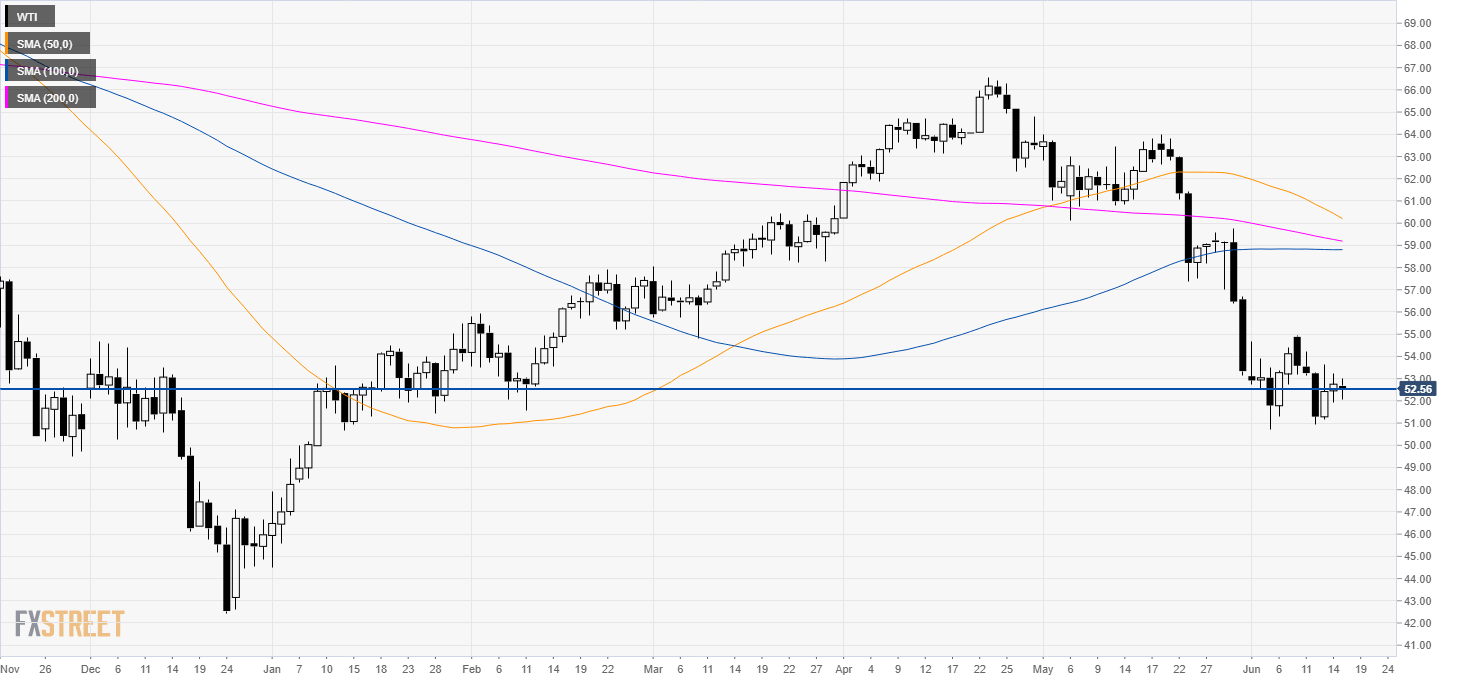
Oil daily chart
WTI (West Texas Intermediate) is in a bear trend trading below its main simple moving averages (SMAs). The price has been coiling around 52.50 since the start of June.

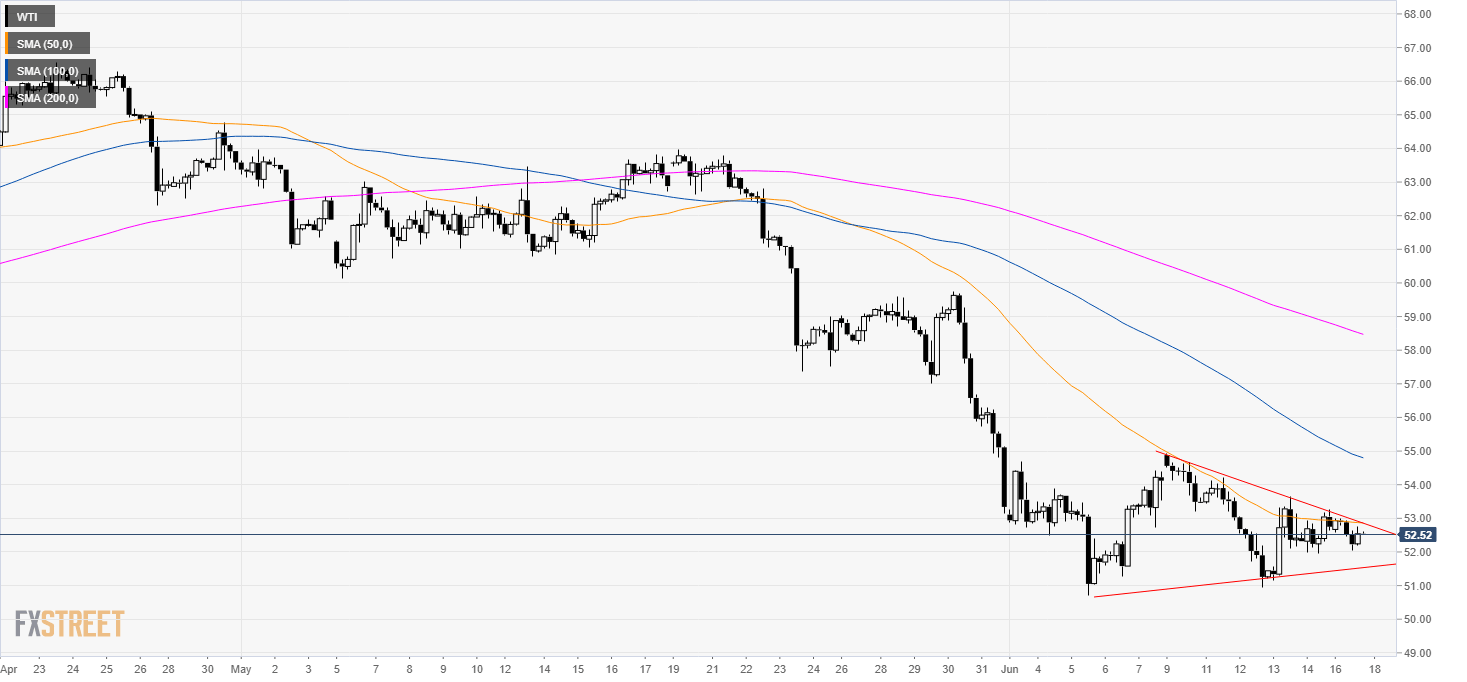
Oil 4-hour chart
The oil market remains under pressure below its main SMAs. The market is forming a triangle pattern which can theoretically break in either direction.
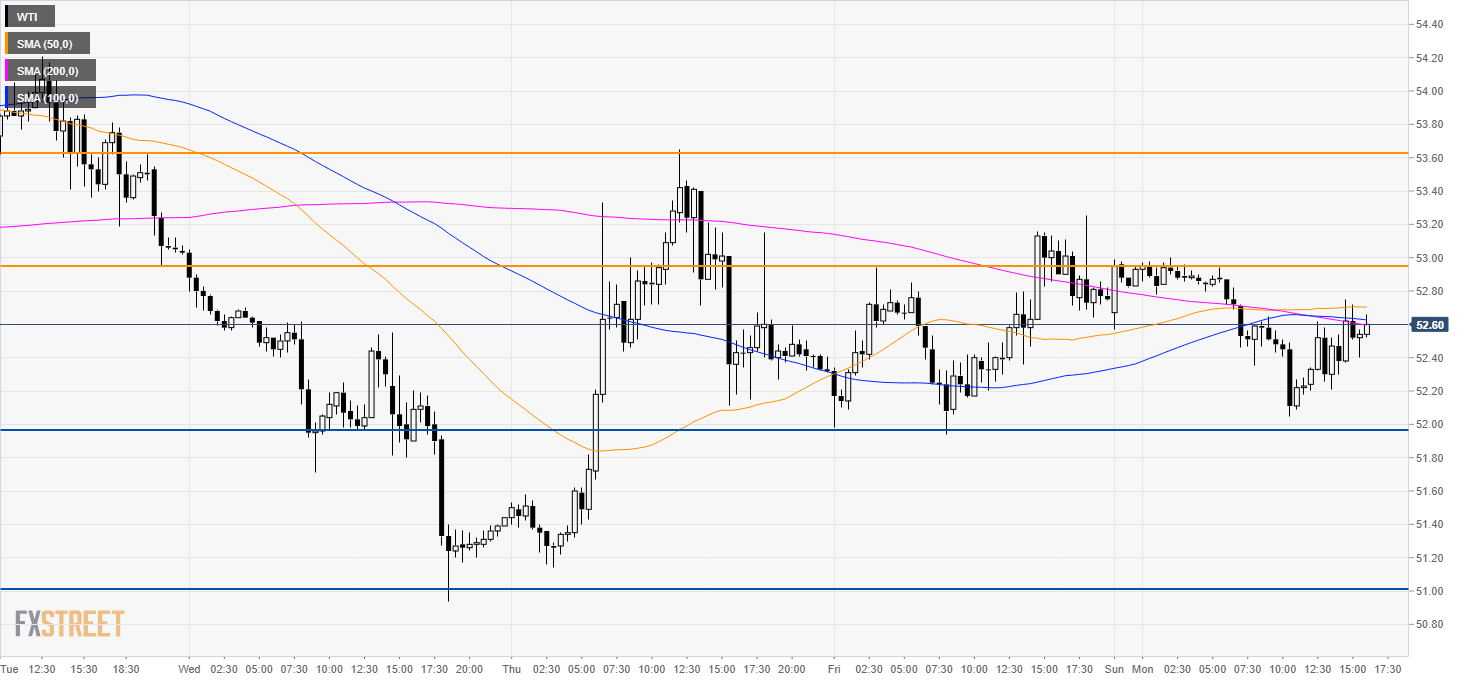
Oil 30-minute chart
The market is trading within Friday’s range. Bears need a breakdown below 52.00 to reach 51.00. Bulls want to break above 53.00 in order to get to 53.60 and 54.00.
Additional key levels
