- USD/JPY remains trapped in its range between 108.16 support and 108.61 resistance
- The level to beat for bulls is 108.70 according to the Technical Confluences Indicator.
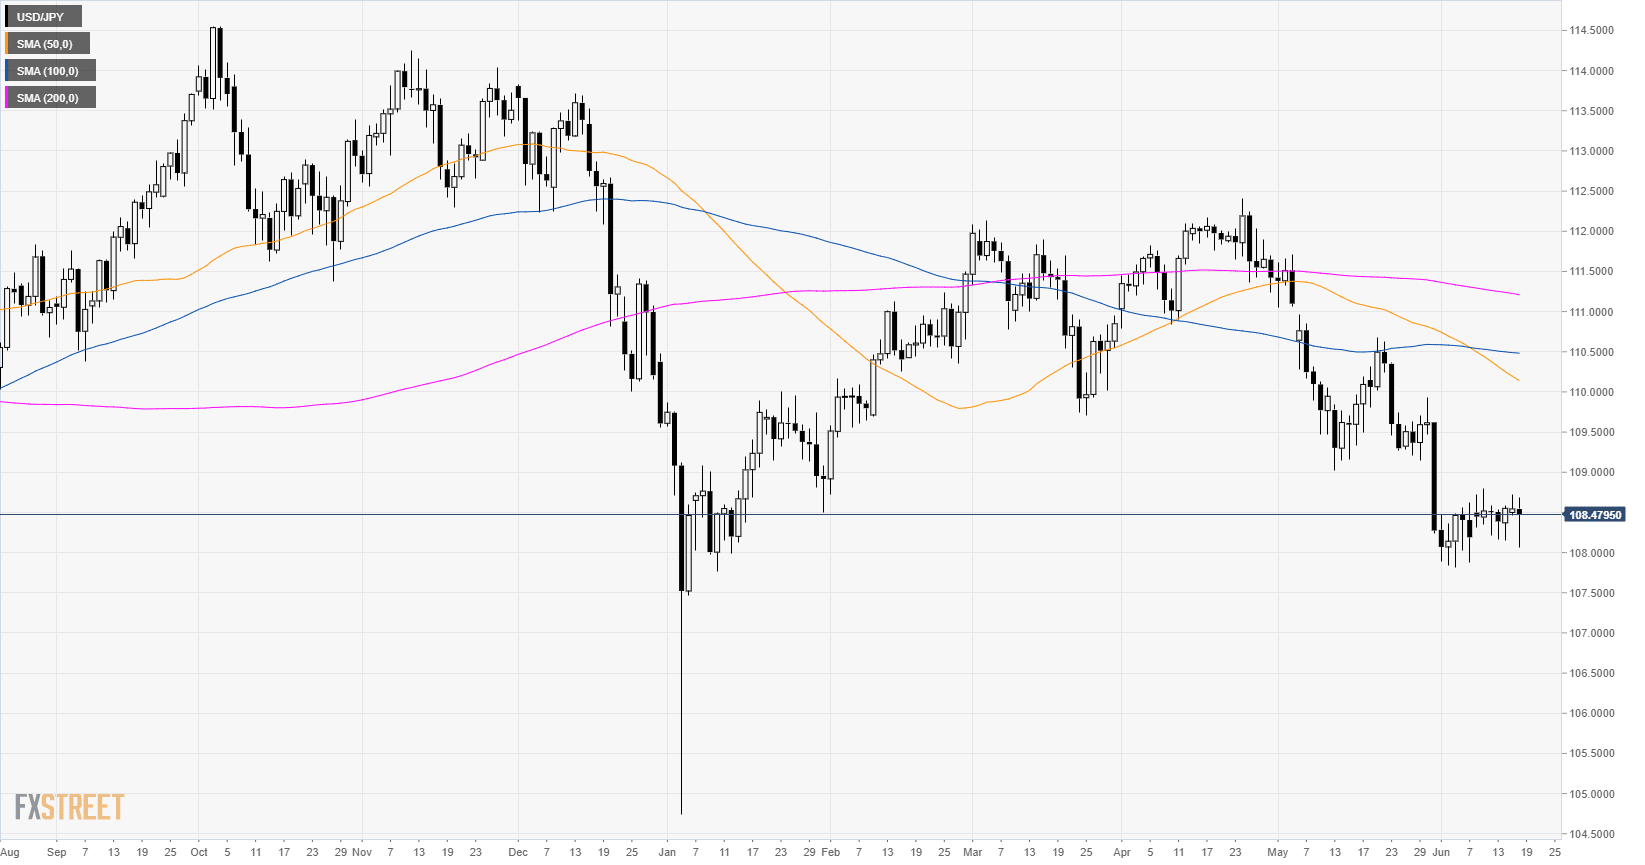
USD/JPY daily chart
USD/JPY is trading in a bear trend below its main daily simple moving averages (DSMAs). The 50 DSMA crossed below the 100 DSMA which is seen as bearish. USD/JPY is entering its eleventh day of consolidation above 108.00.

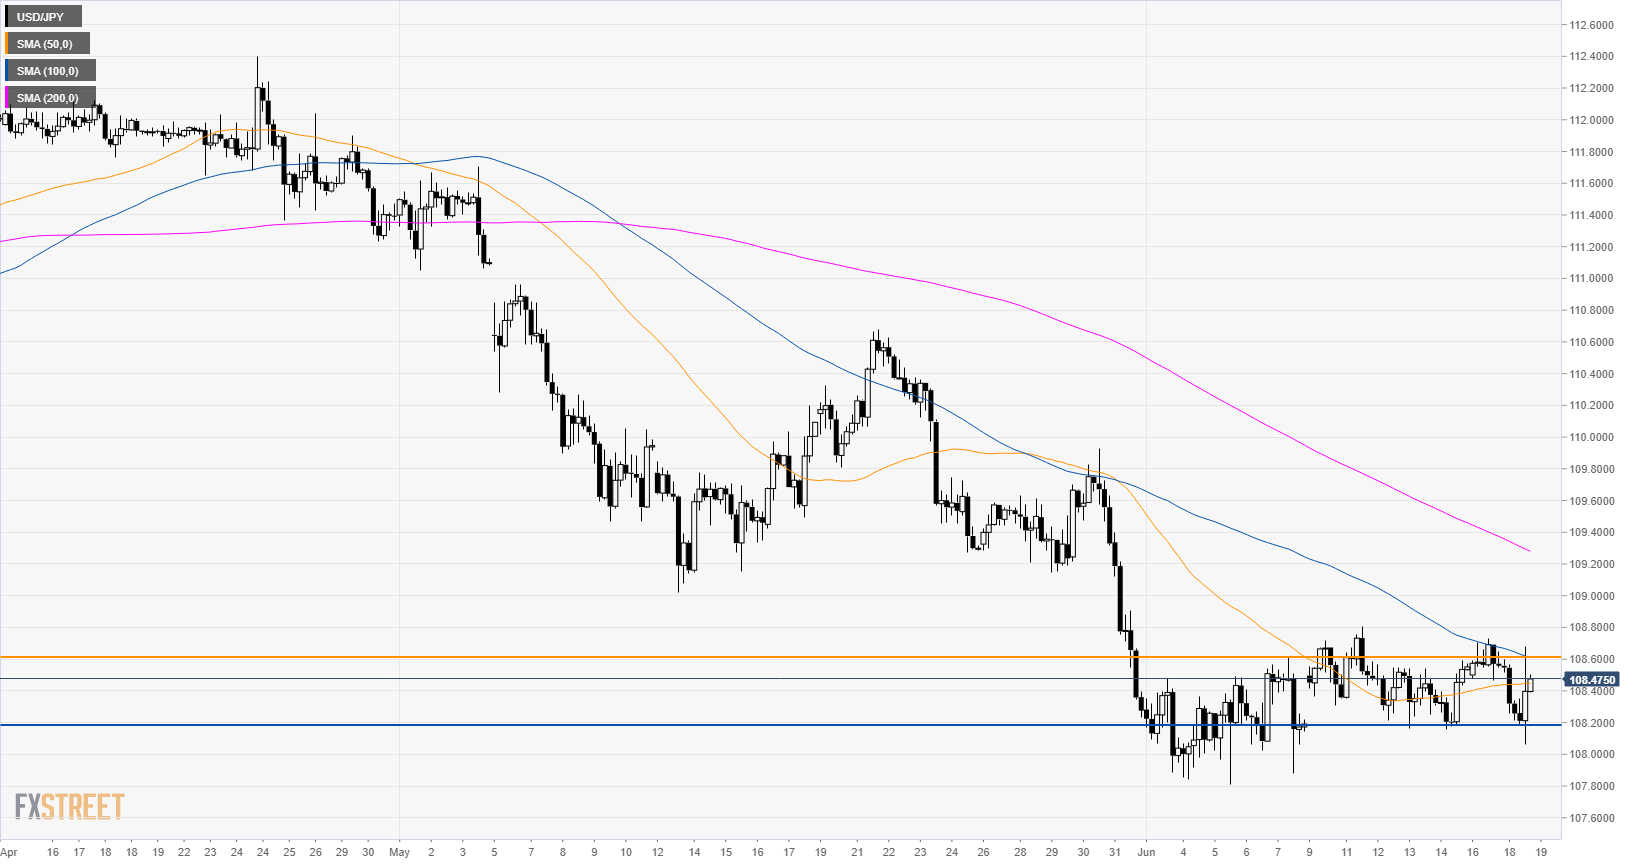
USD/JPY 4-hour chart
USD/JPY is consolidating in the 108.16-108.61 range capped by the 100 SMA.
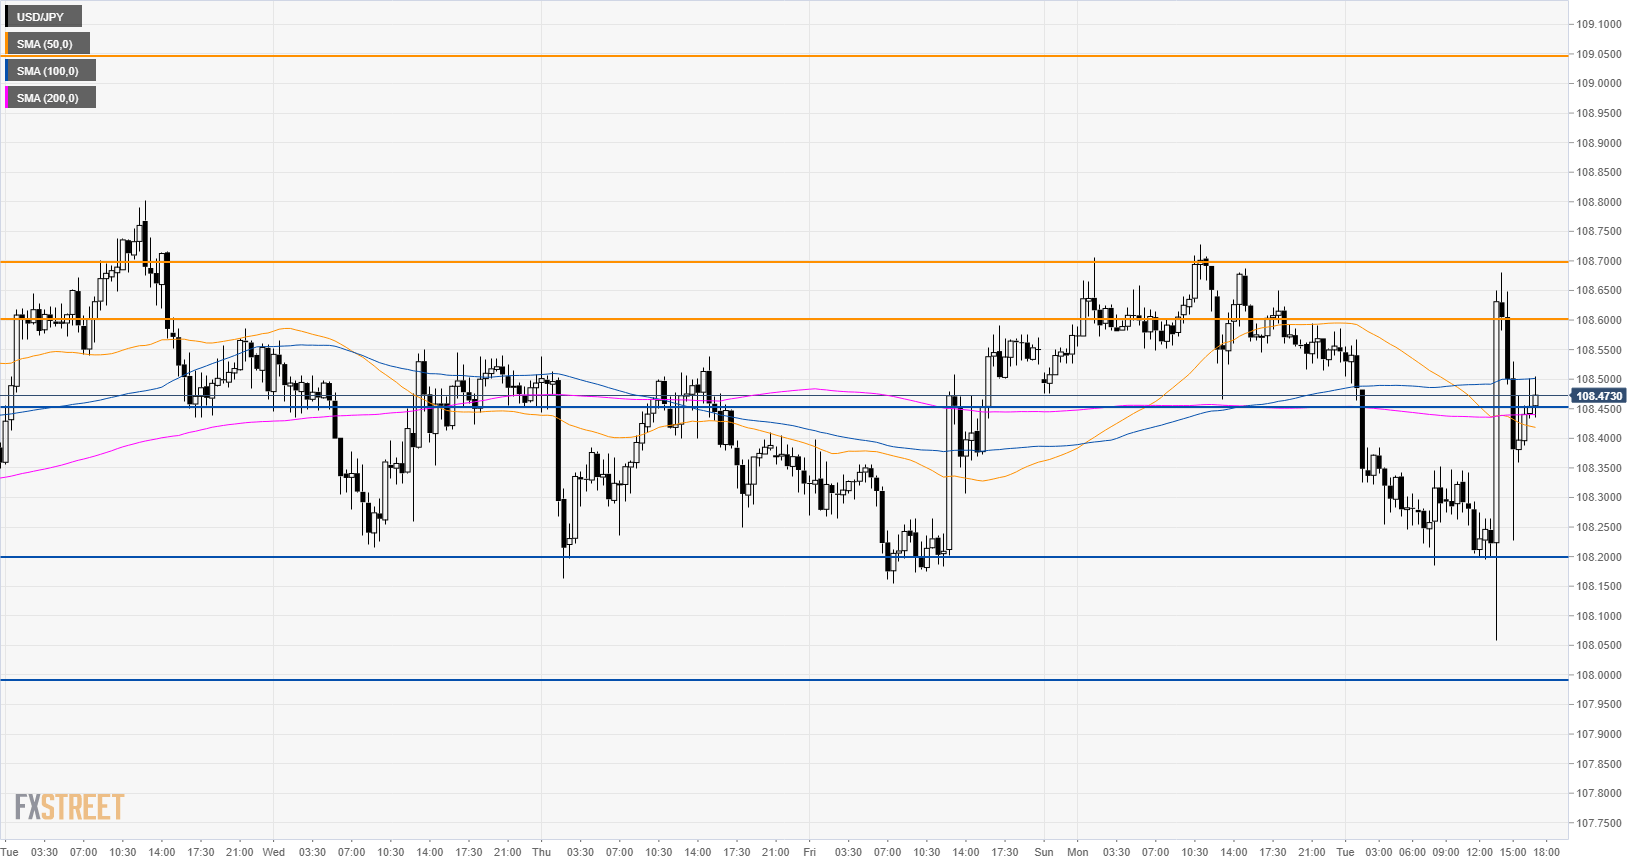
USD/JPY 30-minute chart
The market is trying to find some support near 108.45, which is a key level according to the Technical Confluences Indicator. However, as it stands, USD/JPY remains constrained in its tight range. If bulls overcome 108.70 resistance (Fibonacci cluster) they could reach 108.84 (near the previous week high and the weekly pivot point resistance 1). The next resistance lies near 109.05 (Monthly Fibonacci of 23.6%).
Additional key levels