- NZD/USD’s latest run-up towards 61.8% Fibonacci retracement confronts 50-day SMA.
- 21-day SMA acts as an immediate support
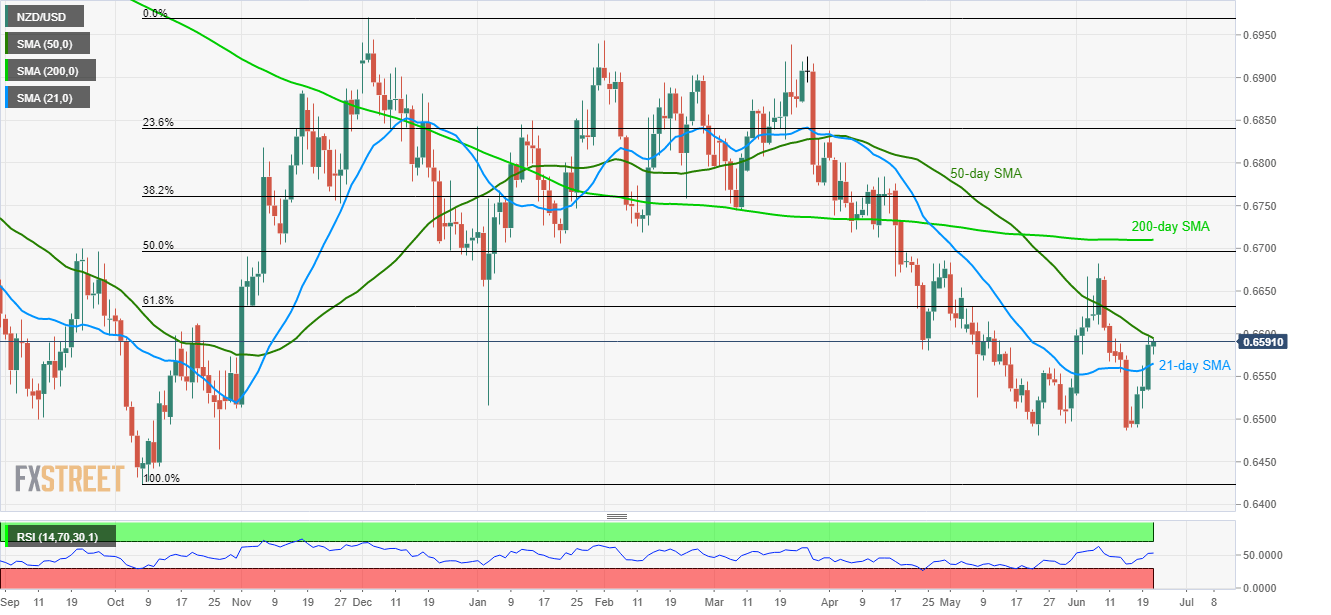
Despite flashing 9-day high, the NZD/USD pair falls short of clearing 50-day SMA as it takes the bids near 0.6592 during the early Asian session on Friday.
Given the pair’s ability to cross 0.6595 immediate resistance, 61.8% Fibonacci retracement of its October – December 2018 upside, near 0.6632, could come back on the chart.
However, additional upside past-0.6632 will have multiple resistances to cross namely current month top of .6682, 50% Fibonacci retracement level of 0.6700 and 200-day simple moving average (SMA) level of 0.6710.
Meanwhile, pullback moves can target the 21-day SMA level of 0.6565 ahead of visiting 0.6525 and 0.6480 supports.
It should also be noted that sellers’ dominance past-0.6480 can recall 0.6460 and 0.6425 as quotes.
NZD/USD daily chart
Trend: Bearish
