- Oversold RSI limits USD/CAD’s further declines around medium-term trend-line support.
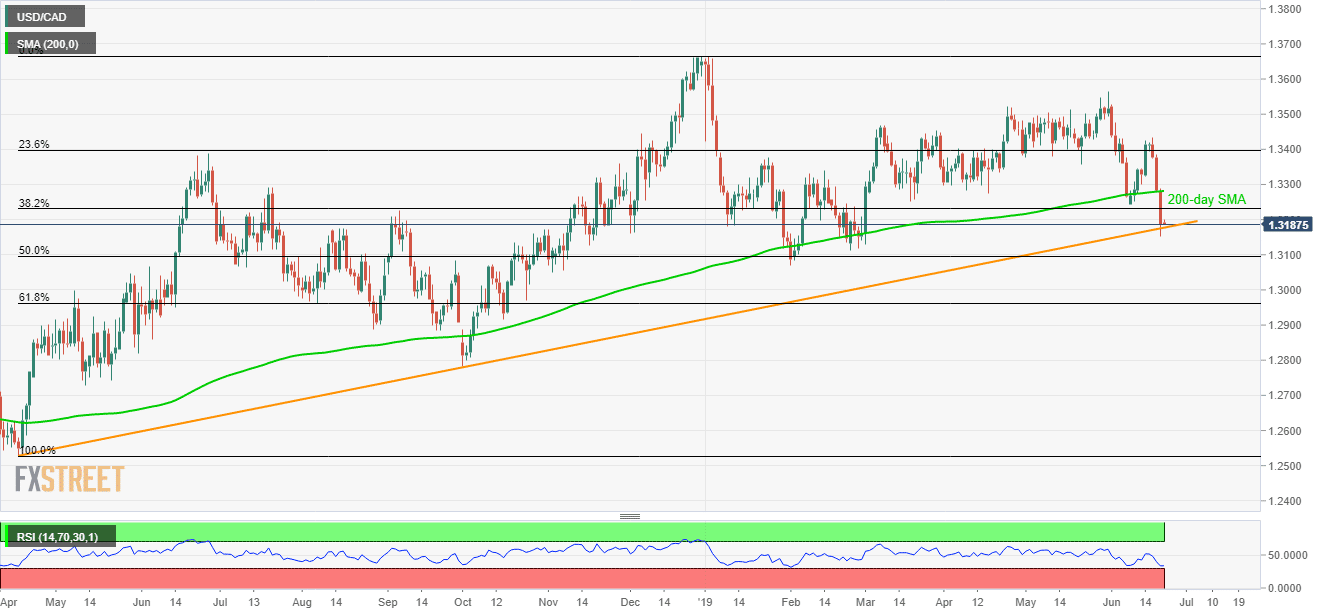
- Sellers cheered the break of 200-day SMA.
Having failed to slip beneath an upward sloping trend-line since April 2018, the USD/CAD pair rests on the medium-term important support-line as it takes the rounds to 1.3190 during early Friday.
While oversold levels of the 14-day relative strength index (RSI) signal brighter chances of the pair’s pullback, sellers continue to dominate unless the quote clears 200-day simple moving average (SMA) level of 1.3280.
Should prices rally past-1.3280, 1.3300 round-figure and May month low near 1.3358 could please the buyers.
On the contrary, a downside break of 1.3177 support-line can fetch the pair to 50% Fibonacci retracement of April – December 2018 period, near 1.3100.
During the pair’s additional declines below 1.3100, the current year’s low around 1.3069 and the 1.3000 psychological magnet might lure the bears.
USD/CAD daily chart
Trend: Pullback expected
