- Aussie buyers cheer sustained trading beyond 21-DMA, aims for immediate resistance-line 50-day SMA.
- Gradually rising RSI, beneath overbought levels, favors break of the key upside barriers.
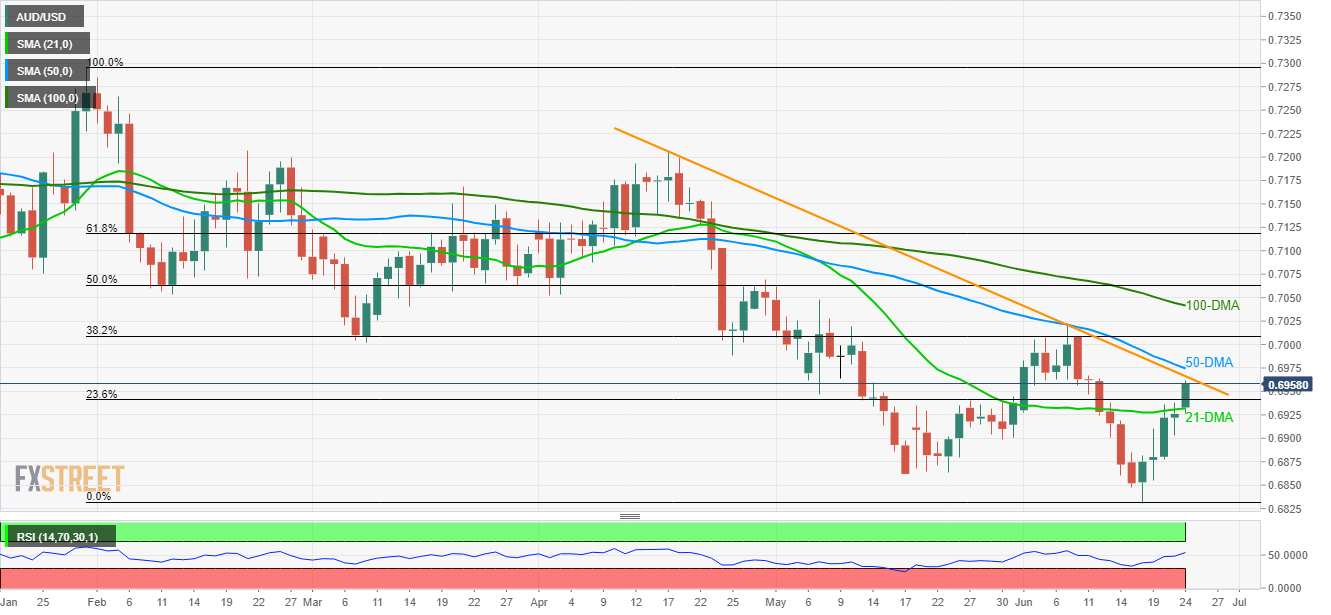
With the AUD/USD pair running further up from 21-day moving average (21-DMA), buyers concentrate on near-term key resistances to justify the latest upside as the quote takes the rounds to 0.6960 during early Monday.
Among the crucial upside barriers, a 9-week old descending trend-line, at 0.6966, becomes the closest resistance to watch ahead of 50-day simple moving average (SMA) level of 0.6975.
It should also be noted that 14-day relative strength index (RSI) is gradually rising and is not in the overbought region, which in turn supports buyers’ claim over the momentum.
During the pair’s advances past-0.6975, 38.2% Fibonacci retracement of its January – June decline near 0.7010 and 100-day SMA level of 0.7042 should grab bulls’ attention.
Alternatively, a sustained decline below the 21-DMA level of 0.6932 can recall 0.6900 and 0.6880 back to the chart.
Also, the latest low surrounding 0.6830 and 0.6800 round-figure could entertain bears’ afterward.
AUD/USD daily chart
Trend: Bullish
