- GBP/USD is declining beloz the 1.2800 resistance.
- Support is seen at 1.2659 and 1.2603 according to the Technical Confluences Indicator.
Less dovish than expected comments from Fed’s Bullard send the USD up across the board. The market is now going to focus on Fed’s Powell at 17.00 GMT.
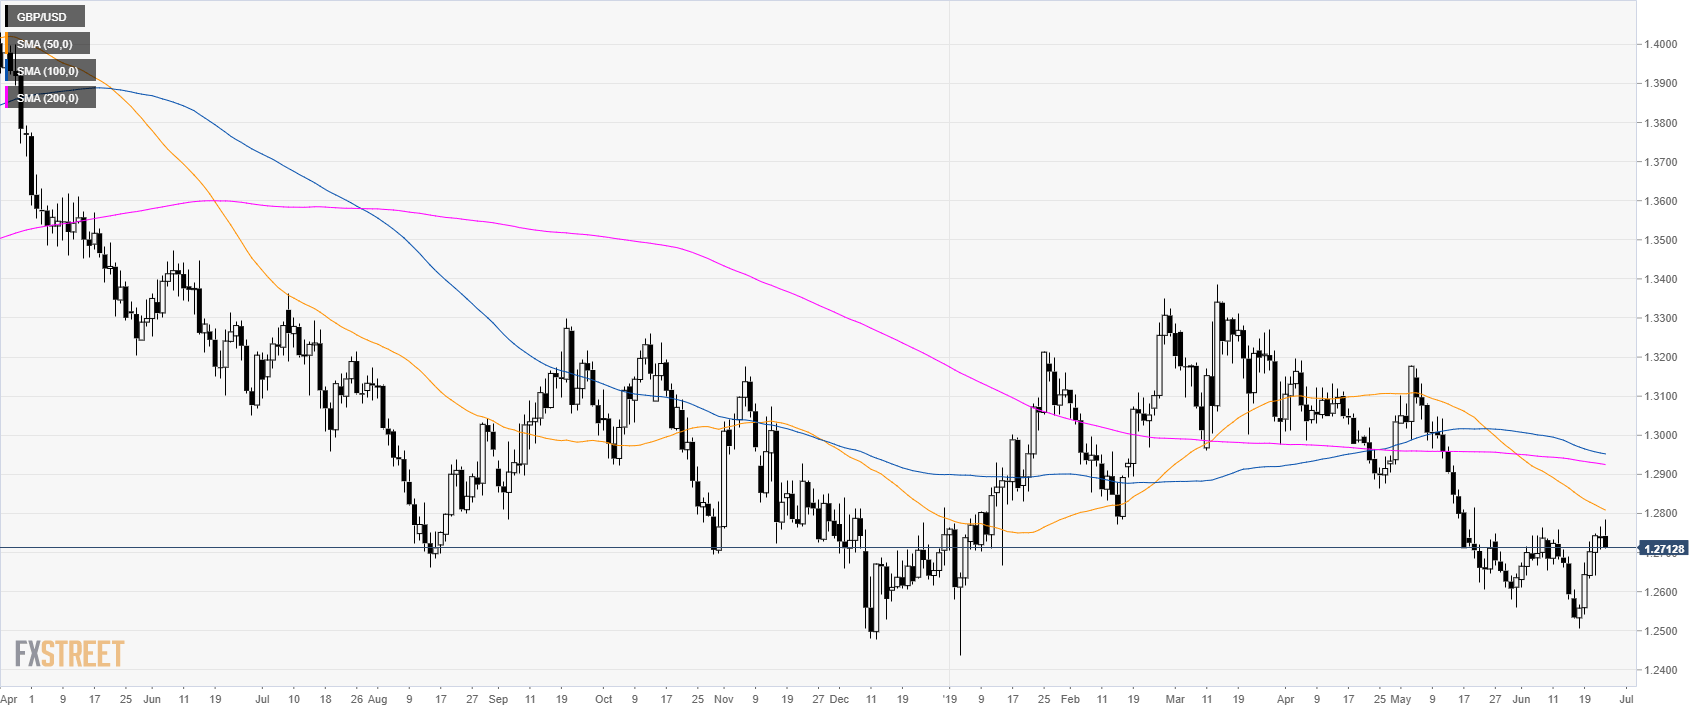
GBP/USD daily chart
GBP/USD is in a bear trend below its main daily simple moving averages (DSMAs). The market is finding resistance below the 1.2800 handle and the 50 SMA.
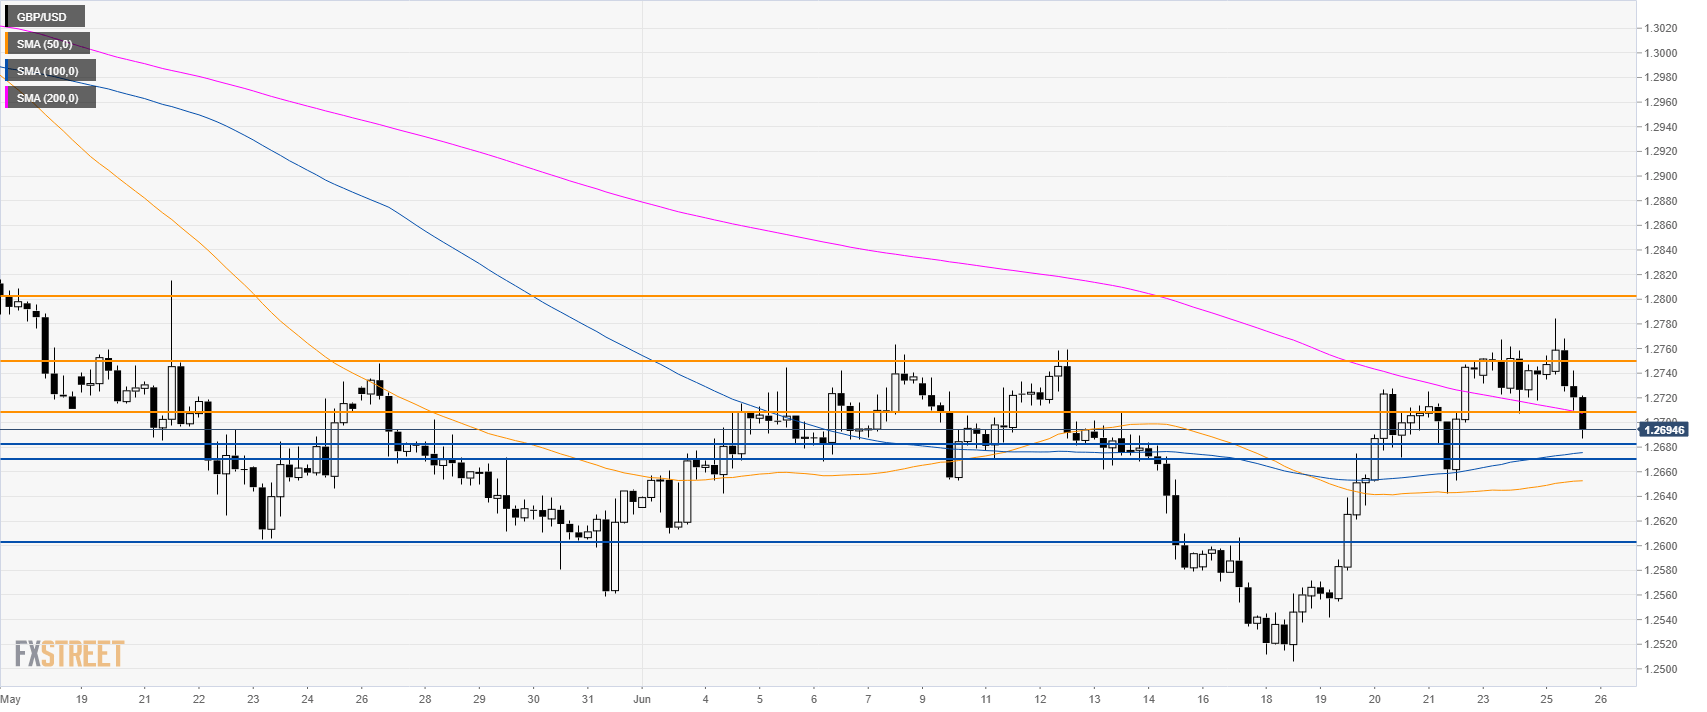
GBP/USD 4-hour chart
Cable is trading below its 200 SMA suggesting bearish momentum in the near term. The next supports are at 1.2682, 1.2659 and 1.2603 according to the Technical Confluences Indicator.

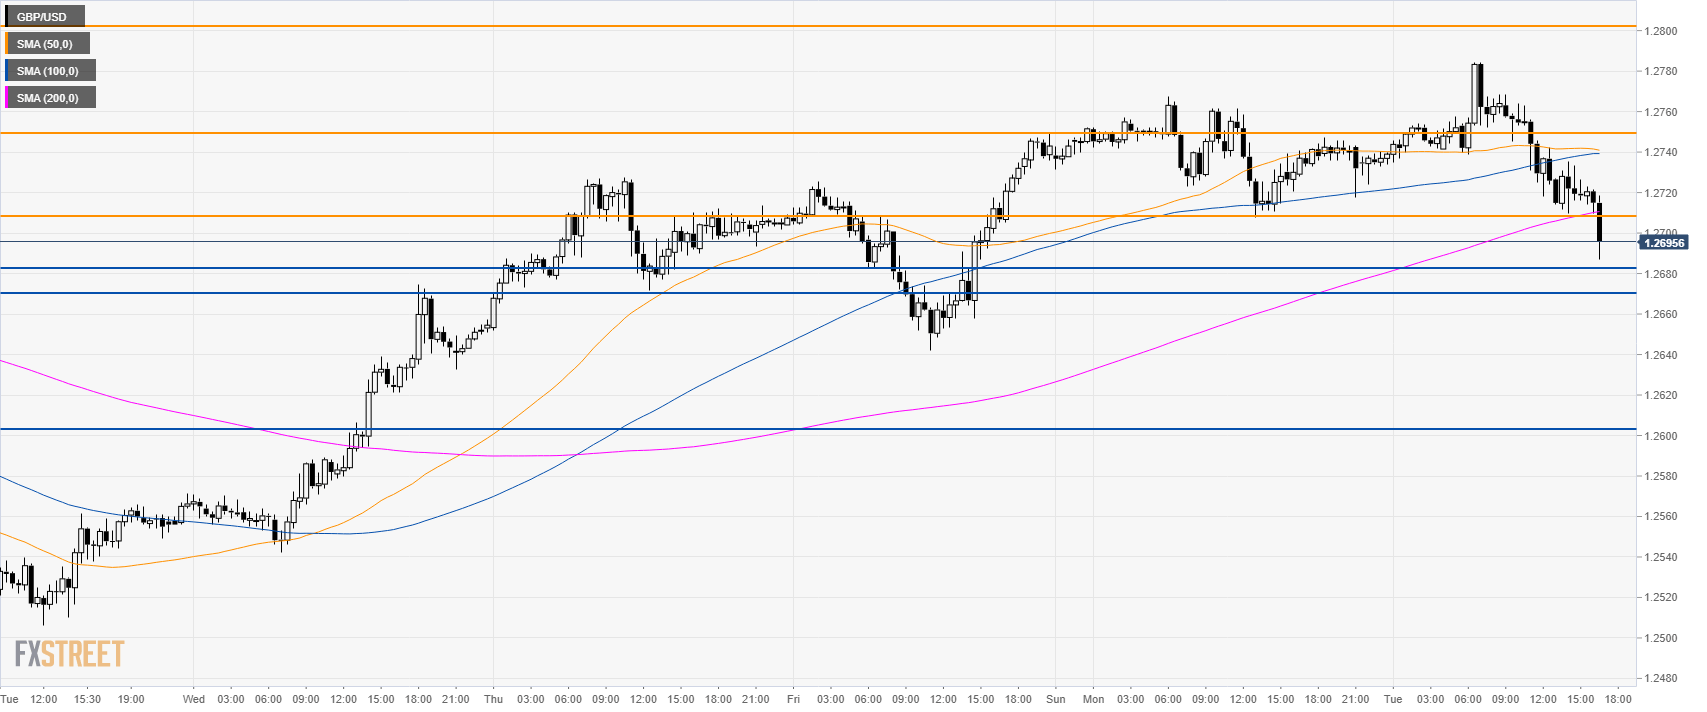
GBP/USD 30-minute chart
GBP/USD is trading below its main SMA suggesting a potential correction down in the near term. Resistances are seen at 1.2708, 1.2750 and 1.2800 levels according to the Technical Confluences Indicator.
Additional key levels