Home S&P500 Index technical analysis: US stocks end the week on the high tick
FXStreet News

S&P500 Index technical analysis: US stocks end the week on the high tick

  • The S&P500 is picking up some steam reaching the 2,950.00 figure.
  • The index can be  on its way for a retest of the all-time high at 2,965.00  
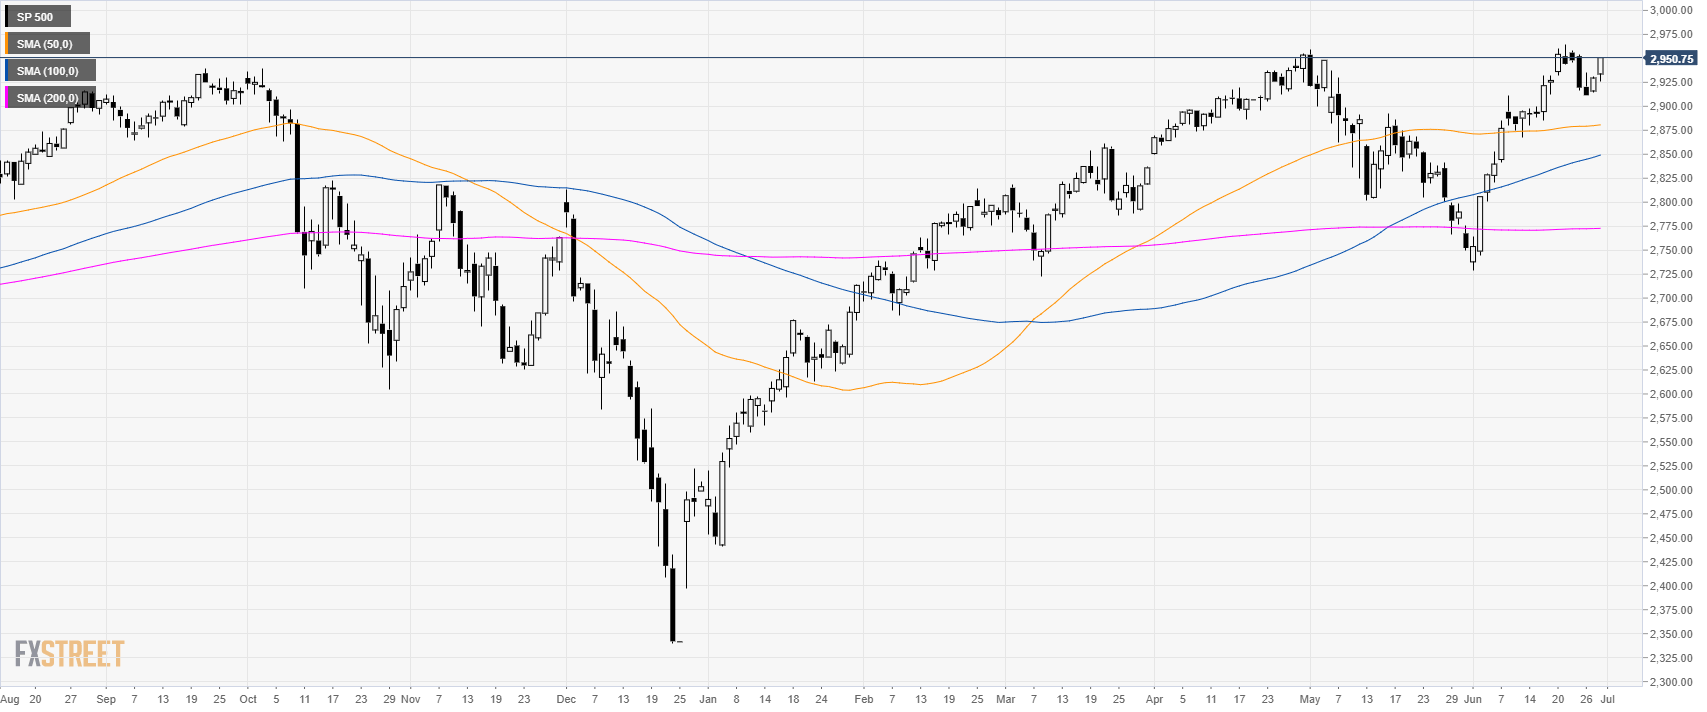
S&P500 daily chart

The S&P500 is trading above its main simple moving averages suggesting bullish momentum. The bulls broke above the 2,940.00 resistance.

S&P500 4-hour chart

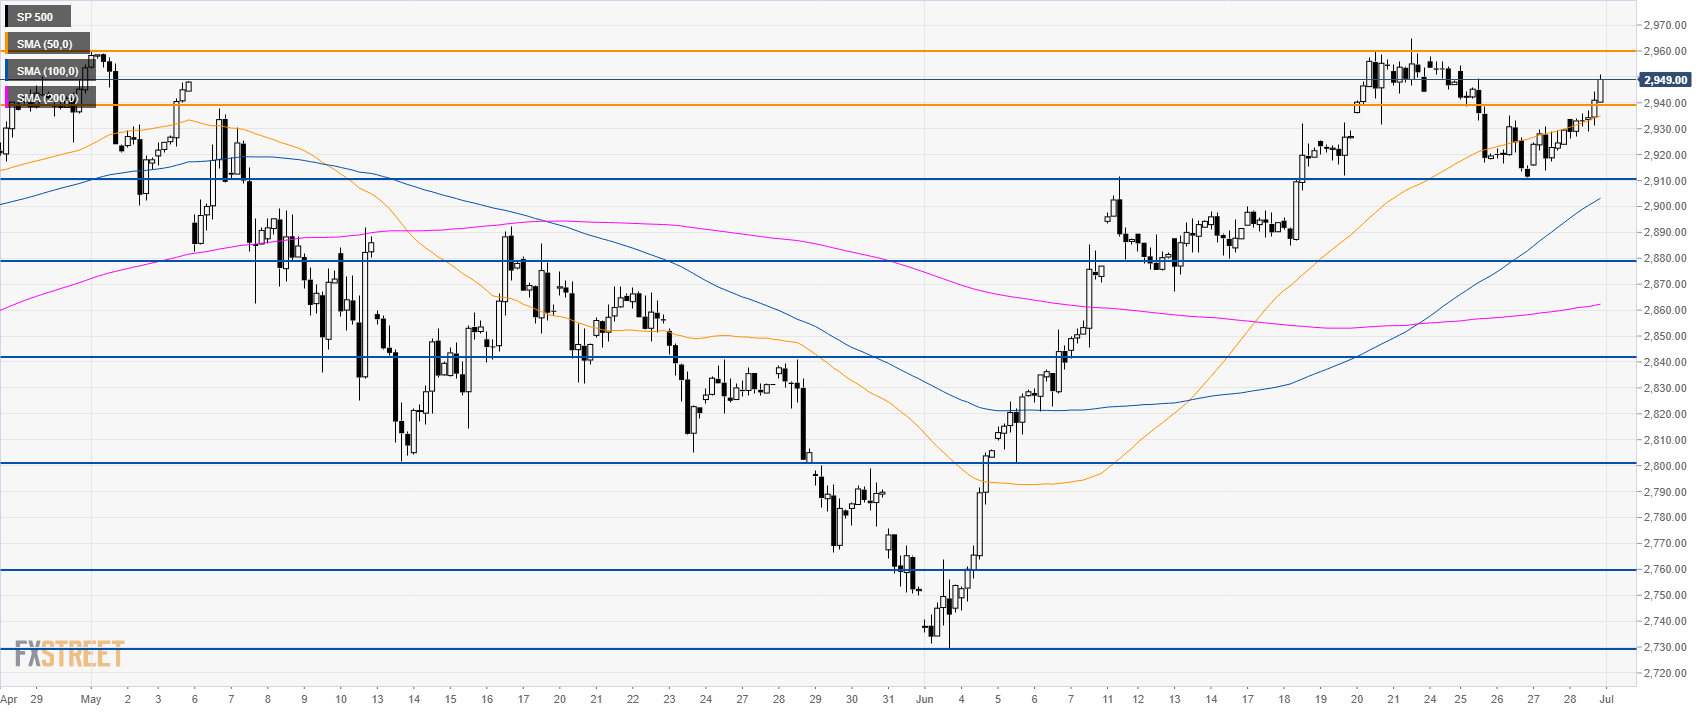
Bulls want a continuation of the bull trend and revisit the all-time high at 2,965.00. On the way, down support is at 2,940.00 and 2,910.00.  

Additional key levels


FX Street

FX Street

FXStreet is the leading independent portal dedicated to the Foreign Exchange (Forex) market. It was launched in 2000 and the portal has always been proud of their unyielding commitment to provide objective and unbiased information, to enable their users to take better and more confident decisions.