- The US Dollar Index (DXY) broke below the 200 DSMA putting the bull trend at risk.
- Immediate resistance is at the 96.46 and 96.74 levels.
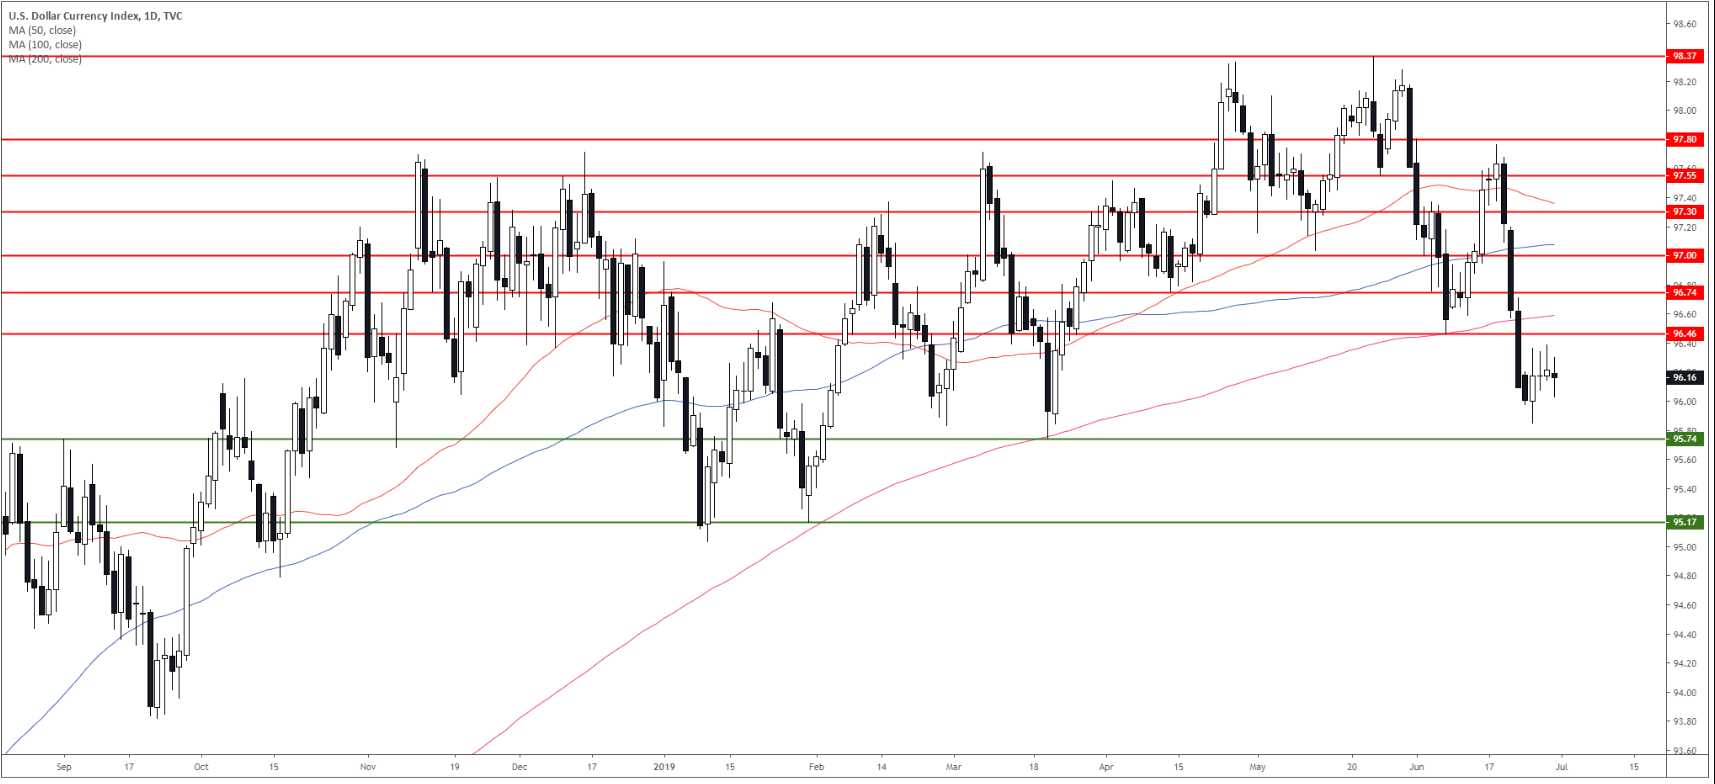
DXY daily chart
The US Dollar Index (DXY) dropped below 96.46 key support and the 200-day simple moving average (DSMA) suggesting a potential halt to the bull trend. DXY is about to end the week virtually unchanged.
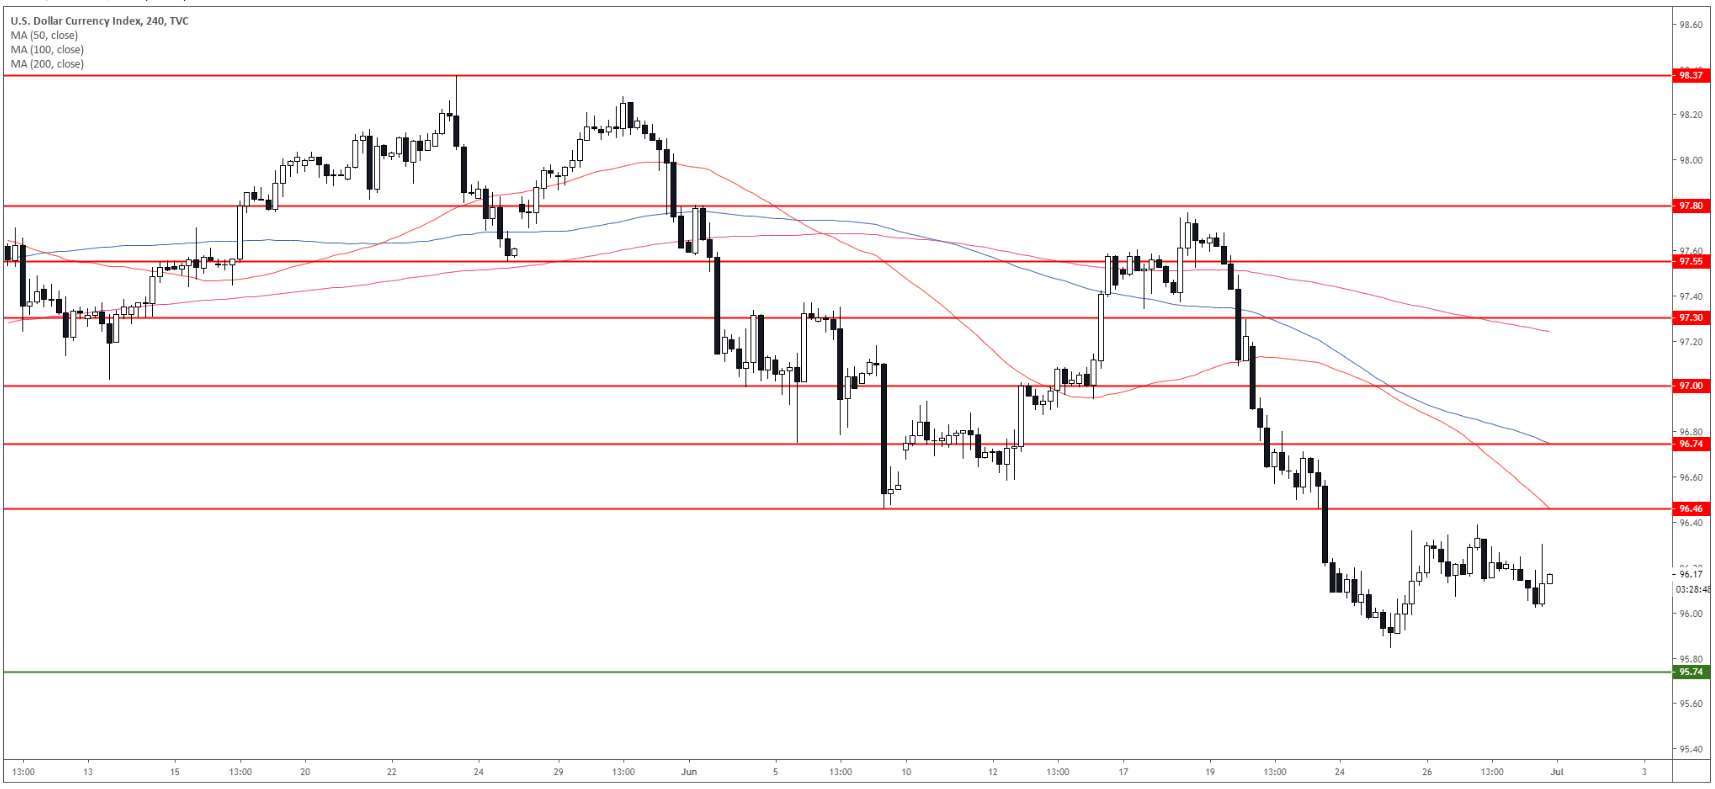
DXY 4-hour chart
DXY is under pressure below its main SMAs suggesting bearish momentum in the near term. Sellers want to reach 95.74 and 95.17 on the way down. Immediate resistance is at 96.46 and 96.74.
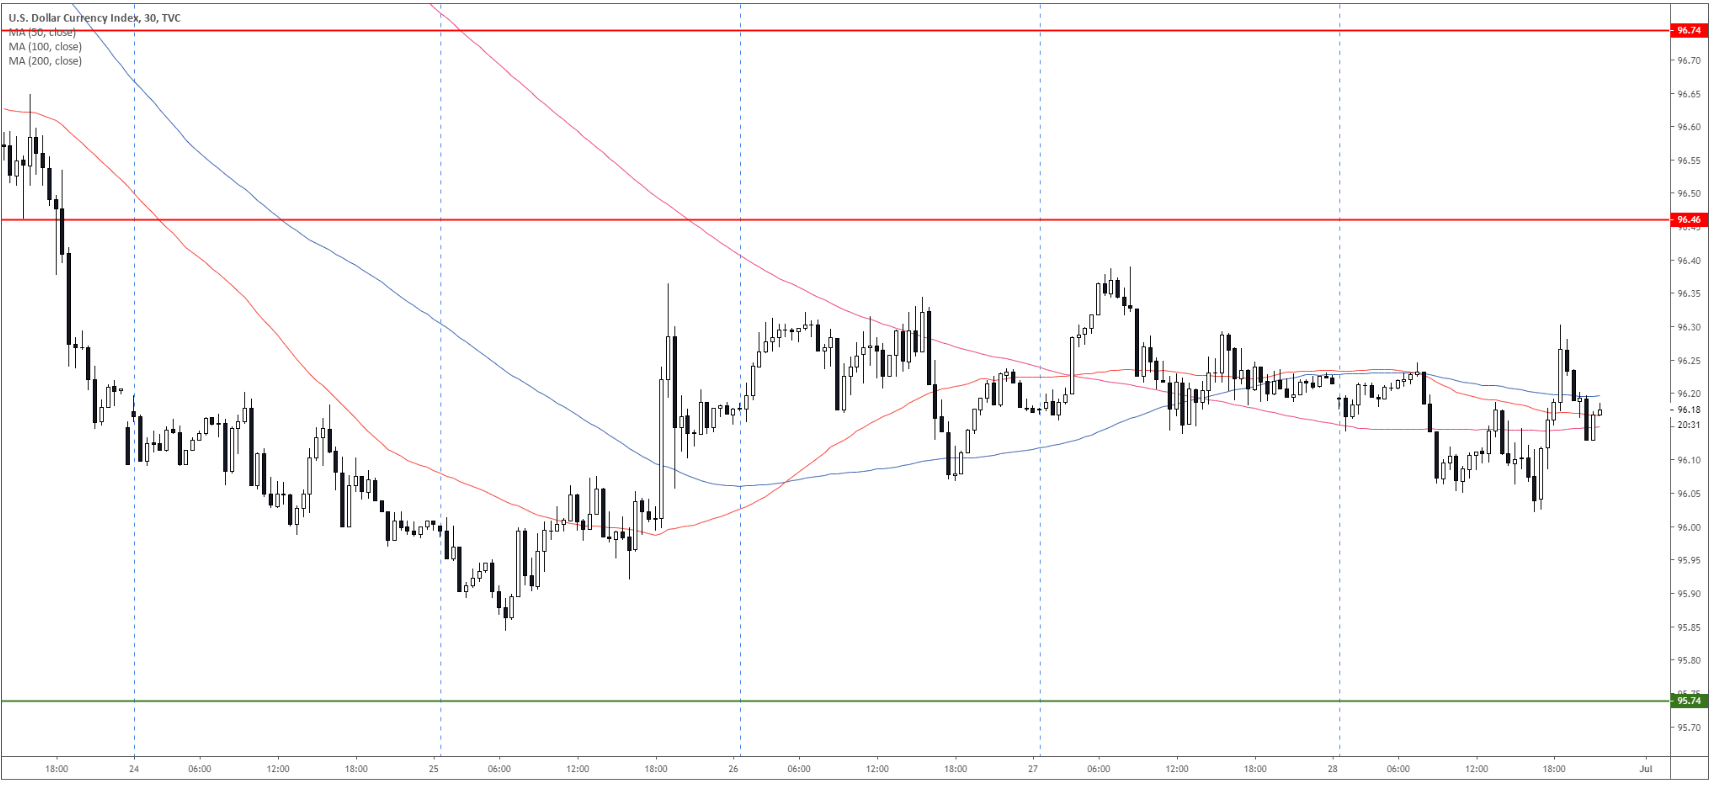
DXY 30-minute chart
The market is consolidating near its main SMAs as DXY remains under pressure below the 96.46 resistance. Buyers would need to break this resistance in order to create a recovery.

Additional key levels