- The market is stabilizing above 107.50 in the near term.
- The level to beat for bulls is at 108.10.
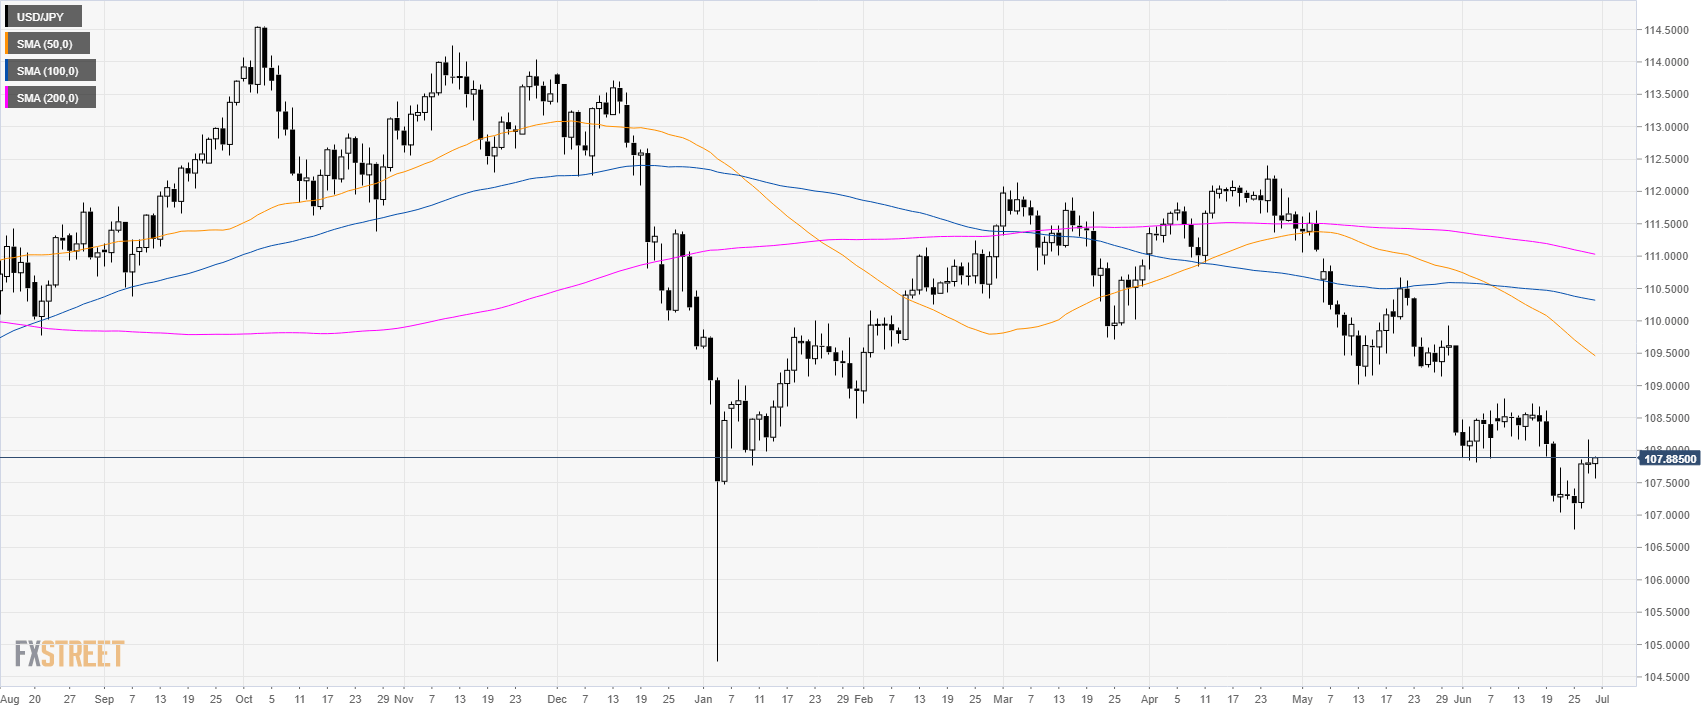
USD/JPY daily chart
USD/JPY is in a bear trend below the main daily simple moving averages (DSMAs). The 50 DSMA crossed below the 100 DSMA which can be seen as bearish.

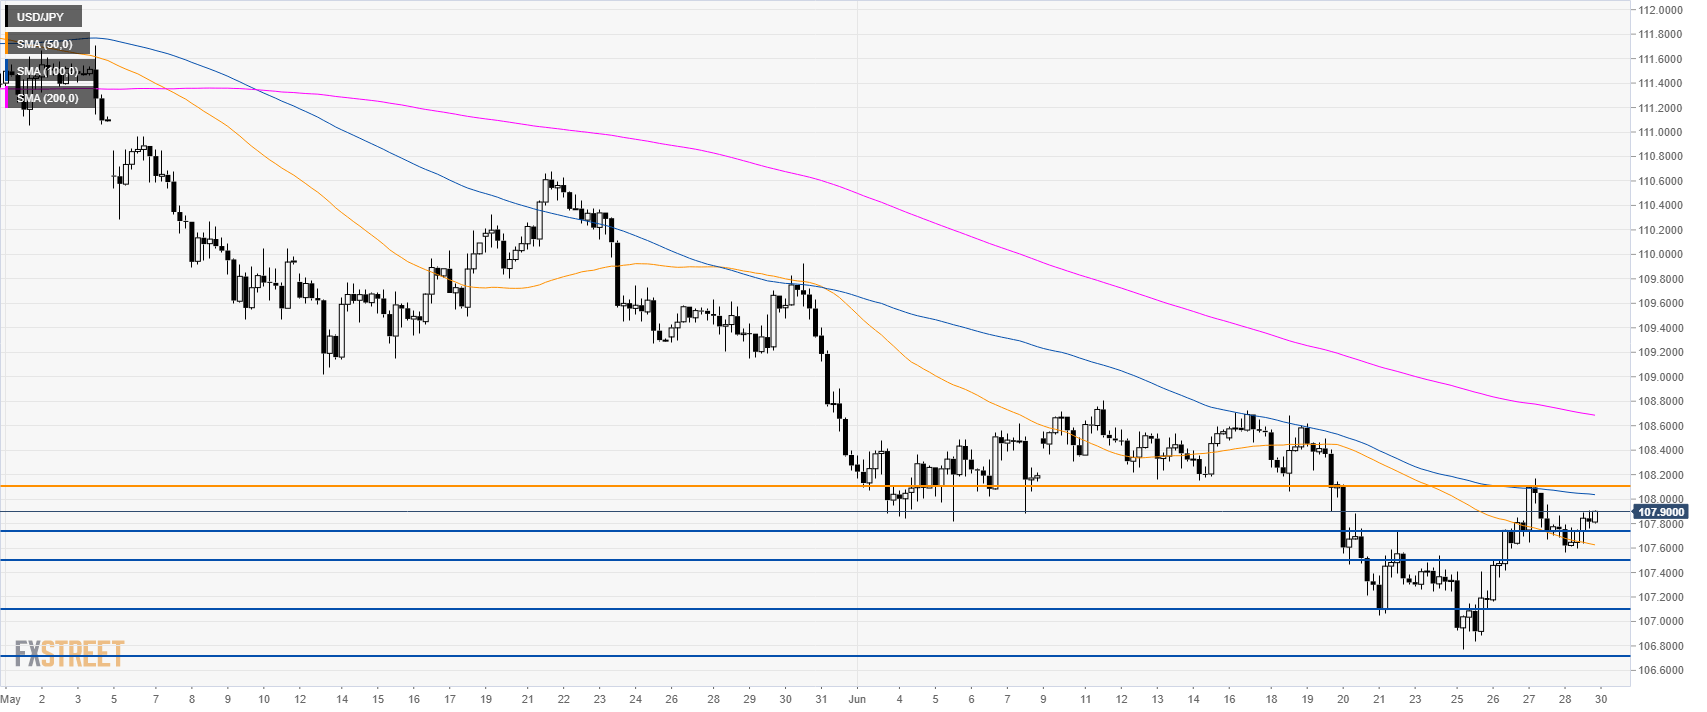
USD/JPY 4-hour chart
USD/JPY is gaining some strength above its 50 SMA. Support is at 107.50, 107.10 and 106.70, according to the Technical Confluences Indicator.
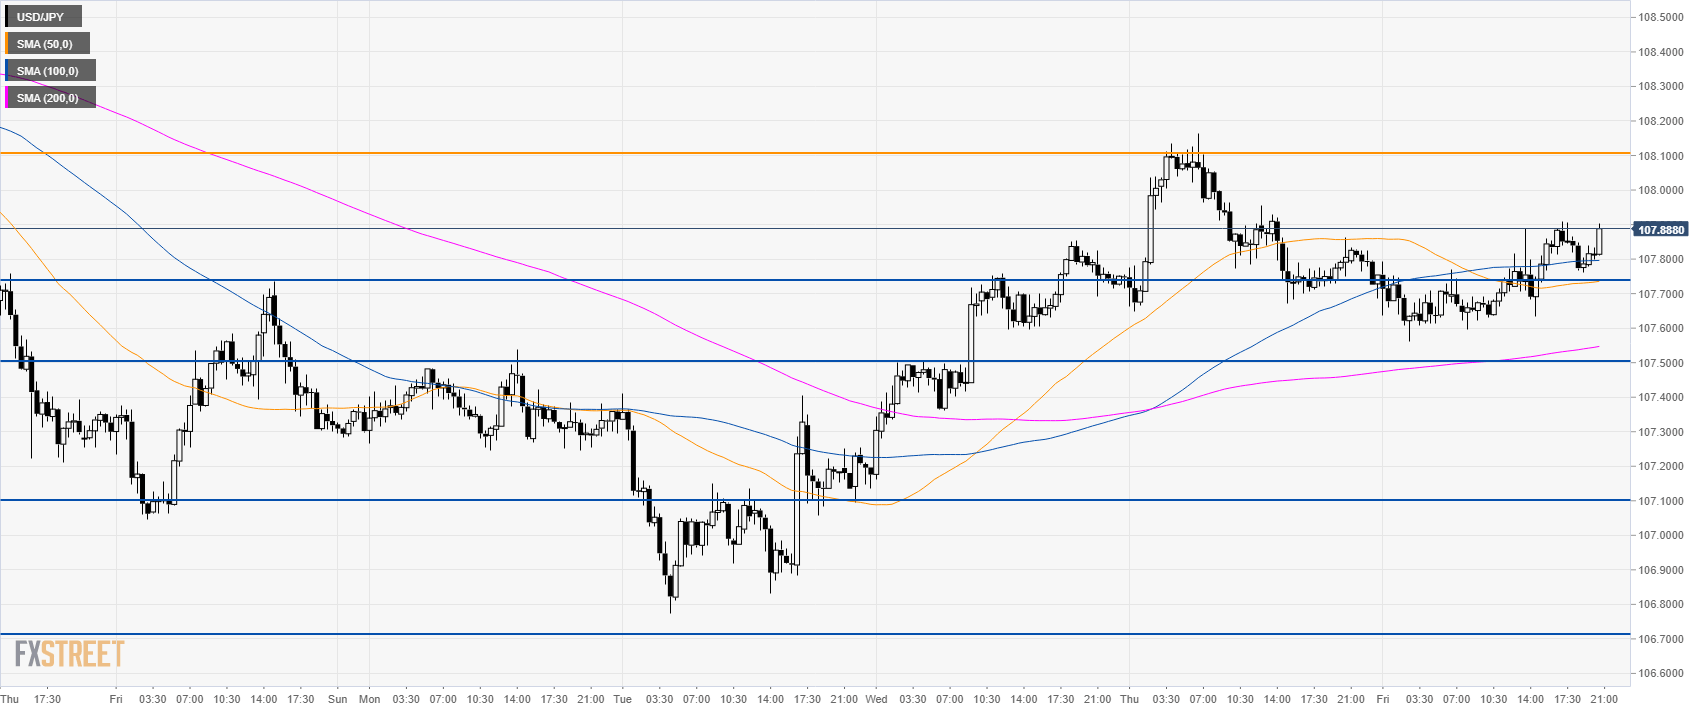
USD/JPY 30-minute chart
USD/JPY is trading above 108.75 resistance and the main SMAs suggesting bullish momentum in the near term. A breakout beyond above 108.10 could open the doors to 108.70 resistance according to the Technical Confluences Indicator.
Additional key levels