- Buyers follow the GBP/USD pair’s failure to slip beneath 200-HMA, near-term ascending trend-line.
- 1.2667, 1.2630 seem key supports on the downside.
With its repeated bounces off the 200-hour moving average (200-HMA), the GBP/USD is taking the bids near 1.2700 during the early Asian session on Monday.
During its recovery, 23.6% Fibonacci retracement of its late-June upside, at 1.2719, is likely immediate resistance to watch ahead of observing latest high surrounding 1.2735.
In a case where prices rally past-1.2735, June 25 top near 1.2785 could become buyers’ favorites.
Alternatively, a downside break of 200-HMA level of 1.2688 can fetch the quote to 1.2667 support-line.
Should there be additional downside past-1.2667, 1.2630 and 61.8% Fibonacci retracement near 1.2612 may act as buffers during the pair’s slump to 1.2570.
GBP/USD hourly chart
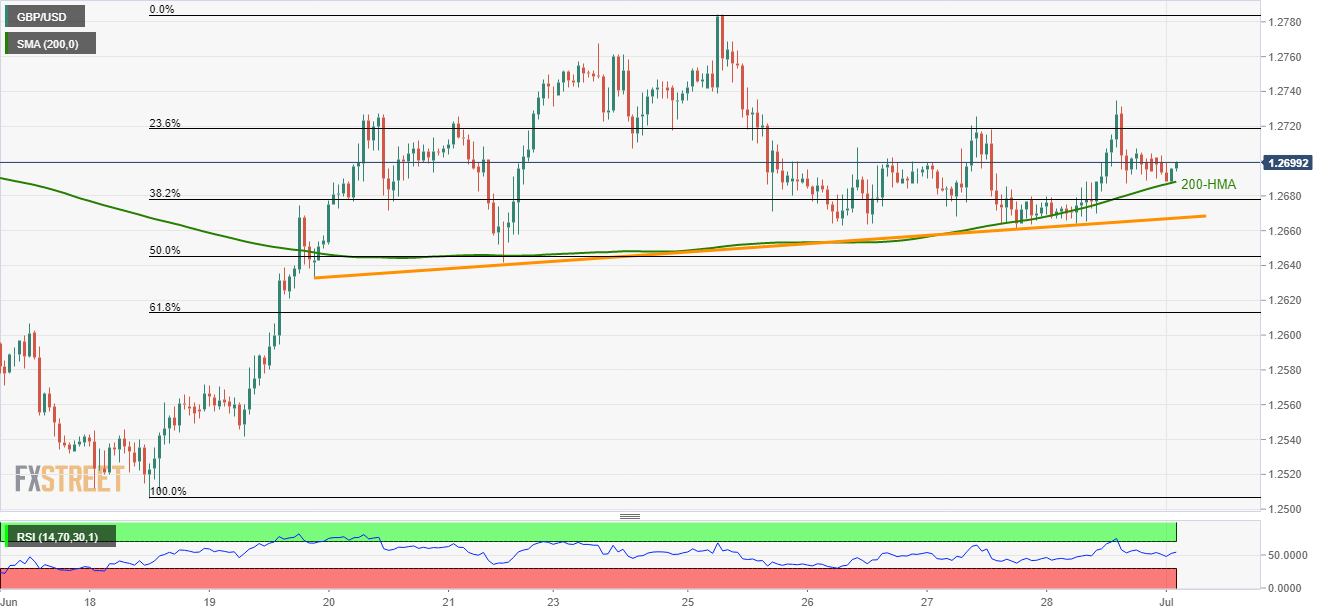
Trend: Bullish
