- The market is gaining bullish momentum above 108.20.
- The level to beat for bulls is at 108.50, strong resistance.
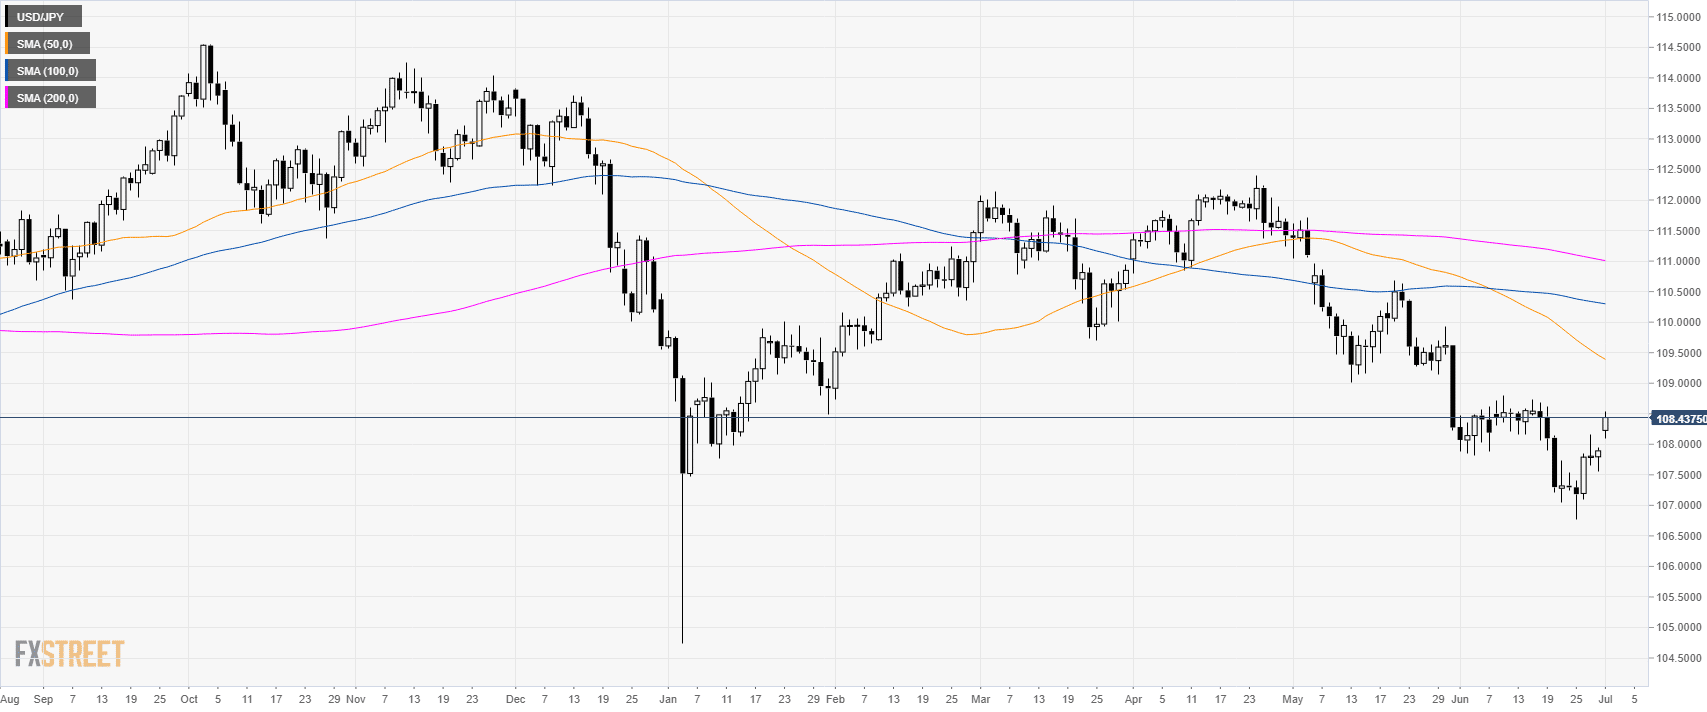
USD/JPY daily chart
USD/JPY is trading in a bear leg below the main daily simple moving averages (DSMAs). The market gapped up this Monday.
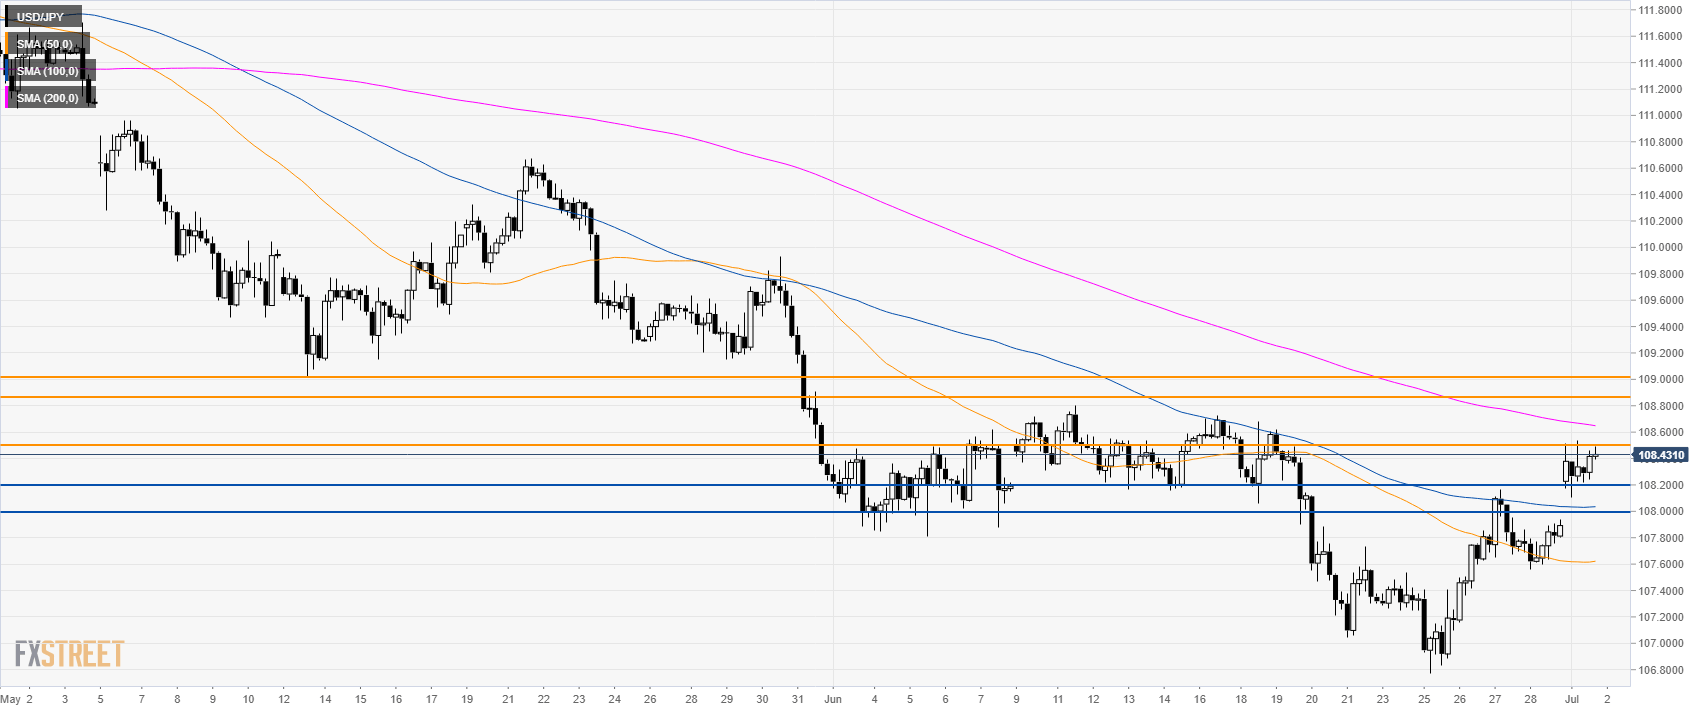
USD/JPY 4-hour chart
USD/JPY is gaining strength above its 50 and 100 SMAs. The market faces strong resistance at 108.50, according to the Technical Confluences Indicator. If broken to the upside, USD/JPY can accelerate towards 108.87 and 109.05 resistances.

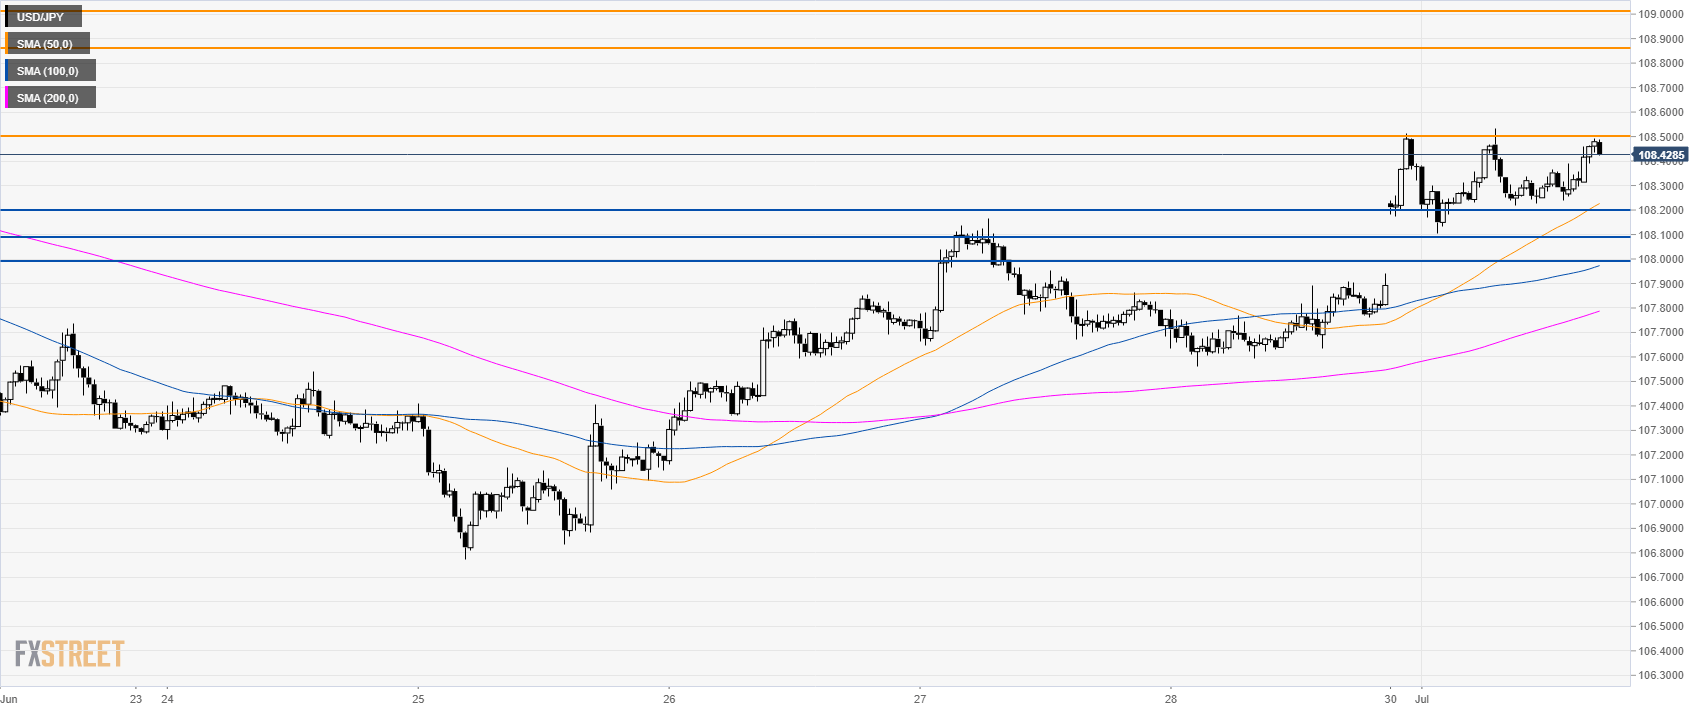
USD/JPY 30-minute chart
USD/JPY is trading above 108.20 and the main SMAs suggesting bullish momentum in the near term. Support is seen at 108.20/09 and the 108.00 figure according to the Technical Confluences Indicator.
Additional key levels
