- Buyers targeting 1.2660/63 need to cross 21-HMA.
- A downside break of 1.2630 support-line can recall the GBP/USD bears.
21-hour moving average (21-HMA) limits GBP/USD recovery from 13-day long horizontal-support as the pair takes the rounds to 1.2645 during early Tuesday morning in Asia.
Gradually rising 14-bar relative strength index (RSI) justifies recent recovery from 1.2630 horizontal-support but buyers need to cross 1.2653 (21-HMA) resistance in order to aim for 1.2660/63 area comprising multiple lows marked during June 26/27.
Given the pair’s further advances past-1.2663, 1.2700 round-figure and a descending trend-line since June 25 at 1.2715 can please the bulls.
Alternatively, pair’s slip beneath 1.2630 support can drag it to 61.8% Fibonacci retracement of late-June upside, at 1.2613 whereas 1.2600 and June 18 high near 1.2560 may become sellers’ favorites then after.
GBP/USD hourly chart
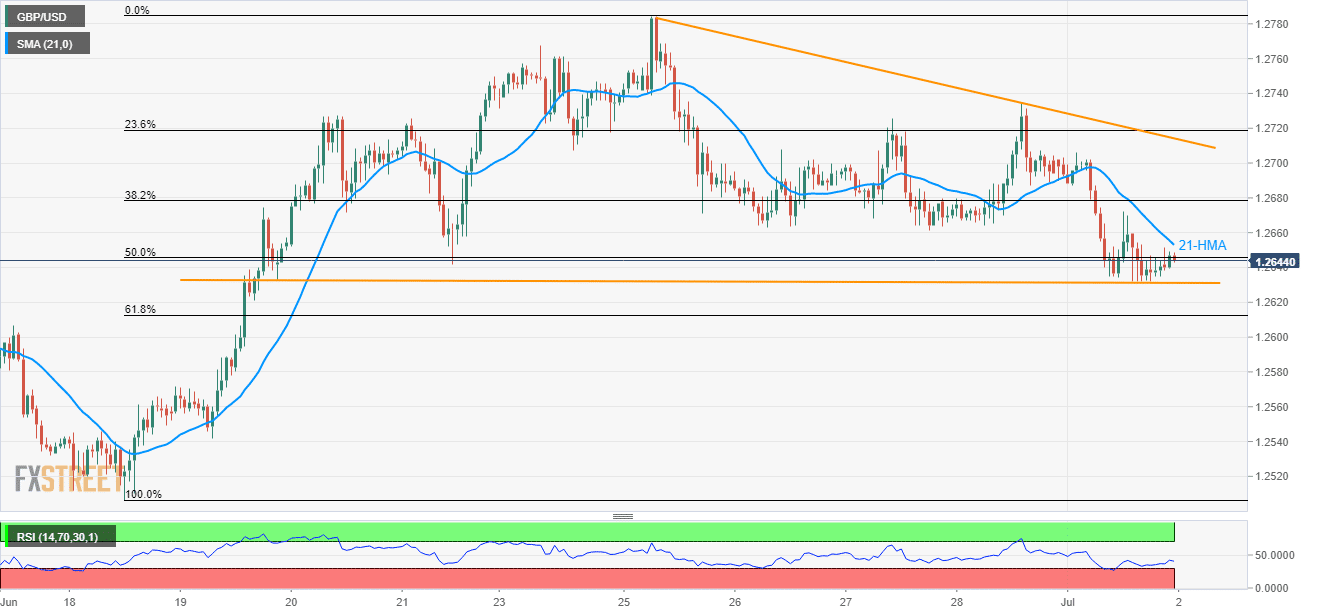
Trend: Pullback expected
