- GBP/USD remains under bearish pressure below the 1.2700 handle.
- The market is currently challenging the daily high near 1.2645 resistance.
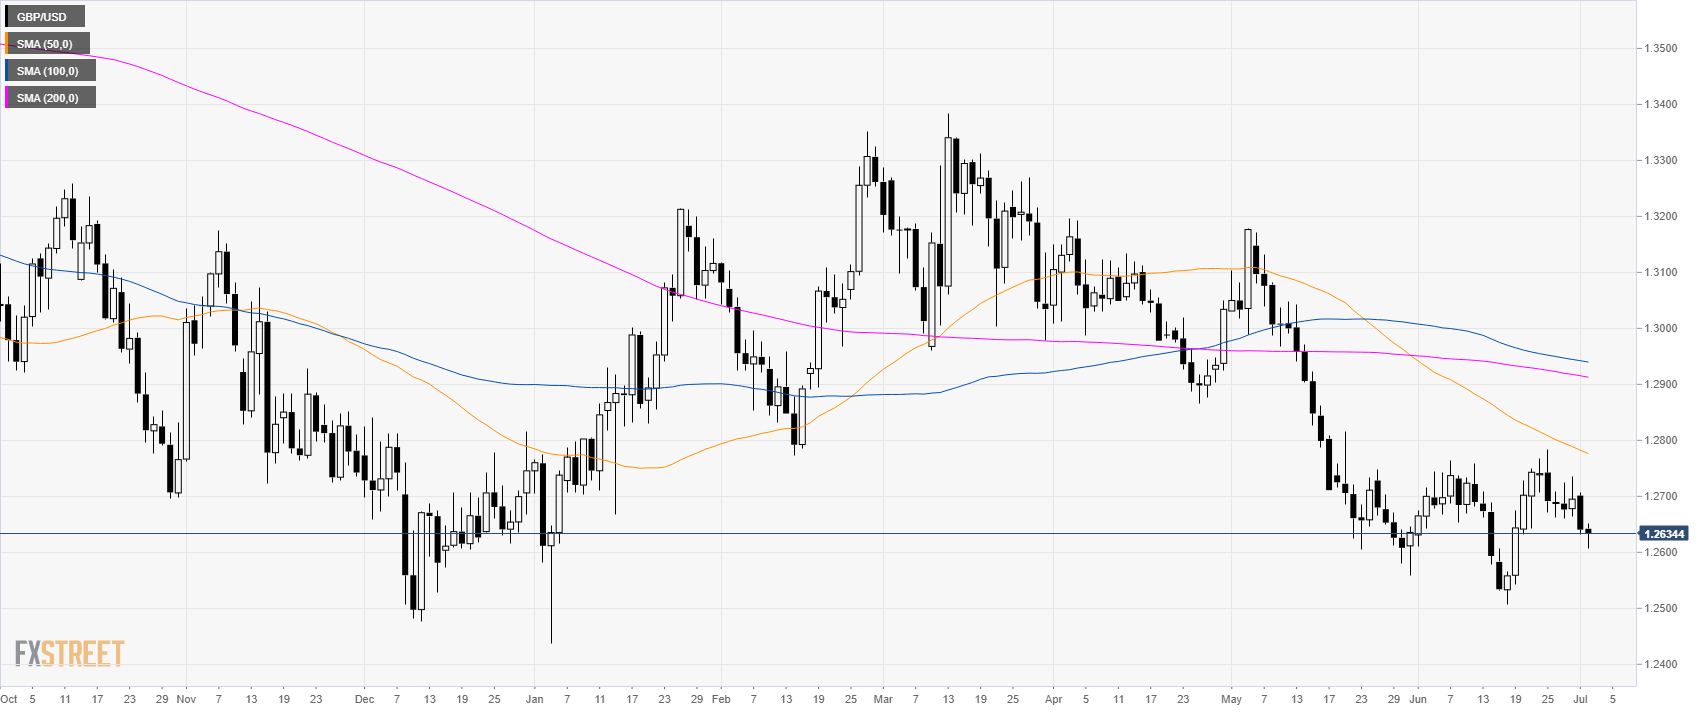
GBP/USD daily chart
GBP/USD is trading in a bear trend below its main daily simple moving averages (DSMAs). The market is under pressure below the 1.2700 figure.
GBP/USD 4-hour chart
Cable is sliding below its main SMAs suggesting bearish momentum in the medium term. The market is bouncing from near the 1.2600 figure and is now testing 1.2645 resistance. If broken to the upside, the market could climb to 1.2665 and 1.2683 resistances, according to the Technical Confluences Indicator.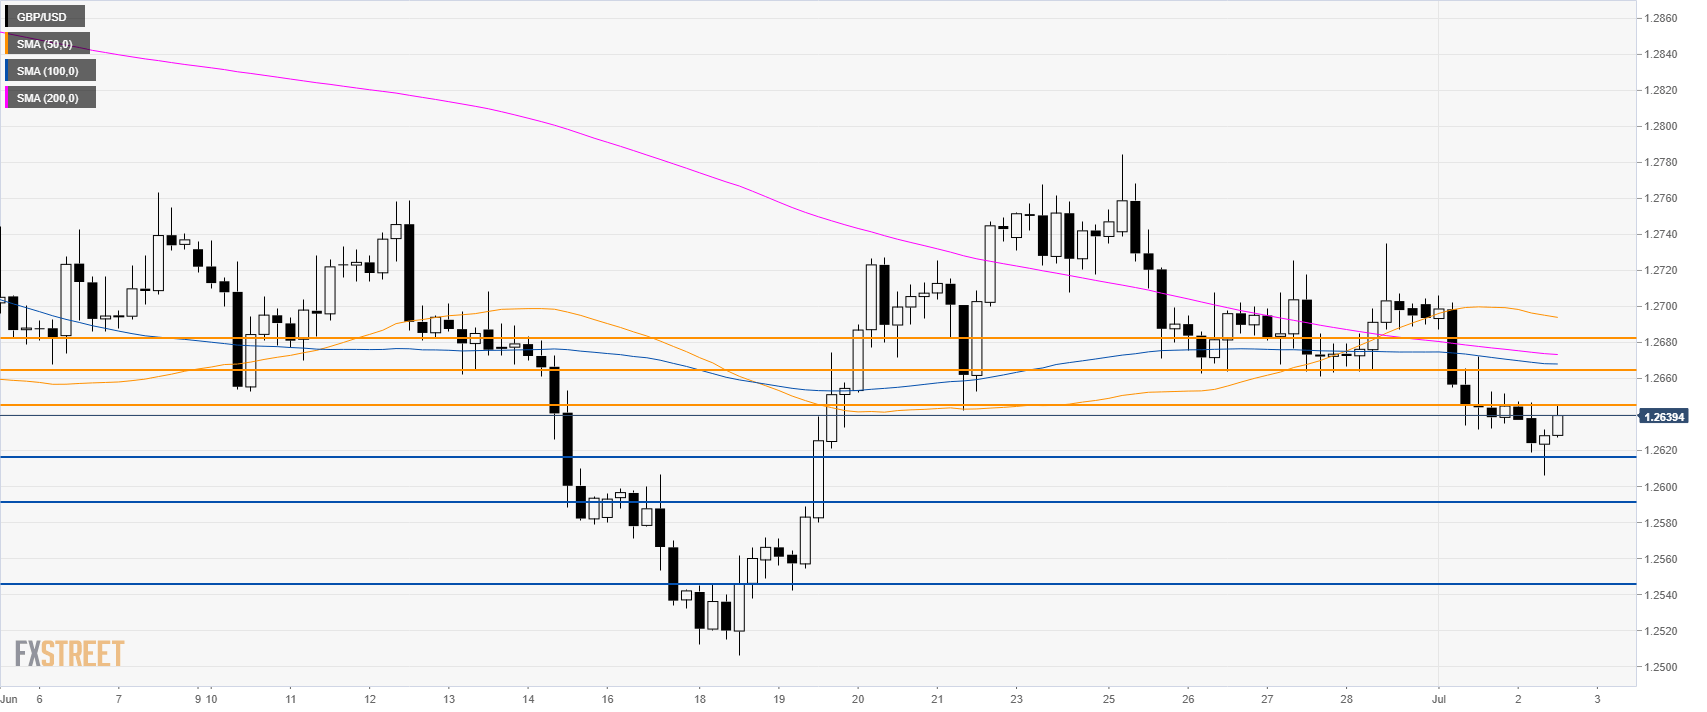
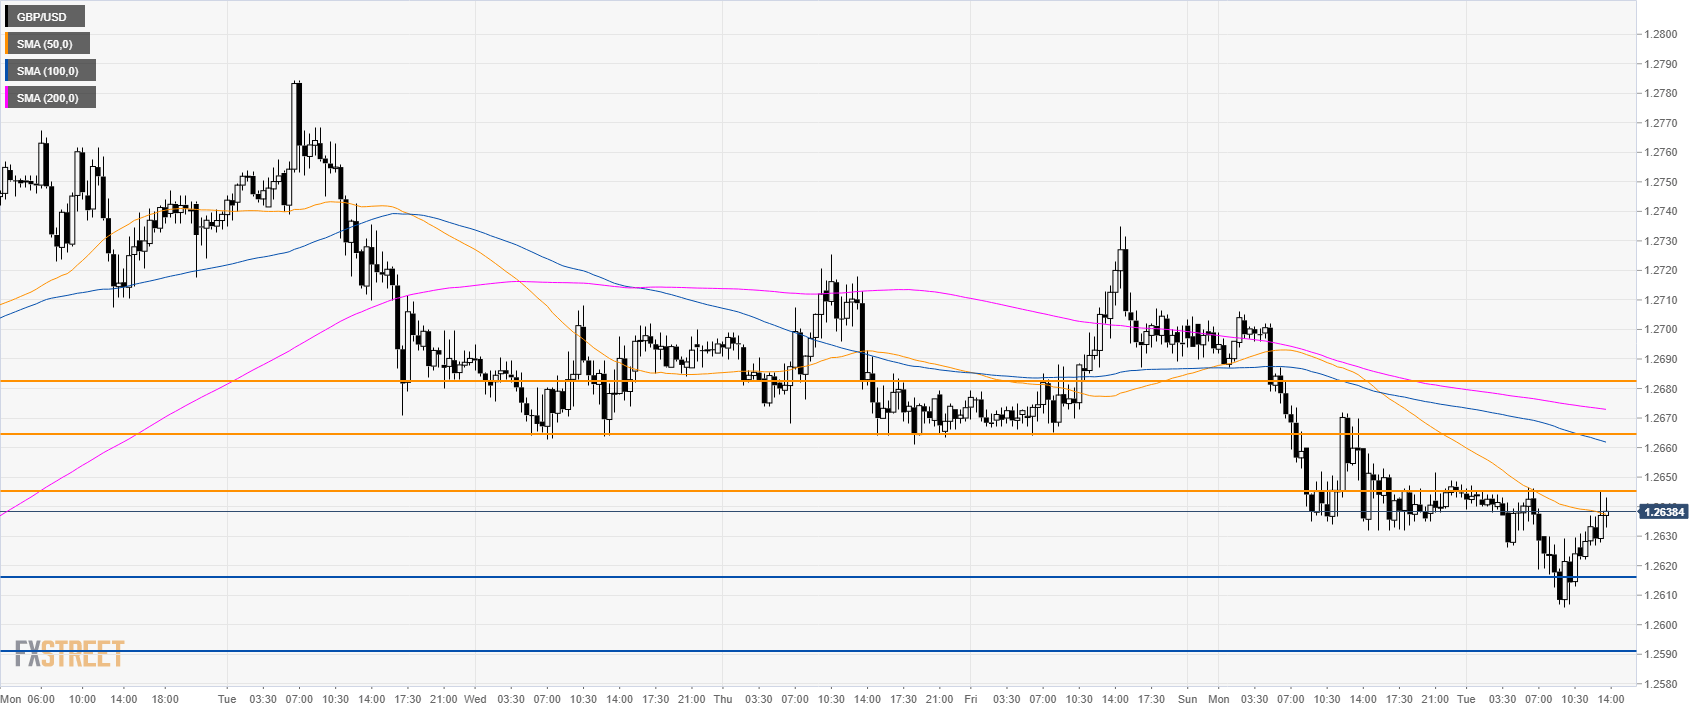
GBP/USD 30-minute chart
GBP/USD is trading below its main SMAs, suggesting bearish momentum. Bears want a continuation down as they can target 1.2617, 1.2591, 1.2545, according to the Technical Confluences Indicator.

Additional key levels