- 23.6% Fibonacci retracement, a fortnight-long ascending trend-line act as immediate supports.
- The U-turn from key rest-points portrays bullish bias towards the latest high.
Although failure to cross 200-day exponential moving average (200-D EMA) dragged the NZD/USD pair down on Monday, short-term upward sloping trend-line triggered the quote’s U-turn as it trades near 0.6677 during early Tuesday.
With the 14-bar relative strength index (RSI) also recovering from latest lows, pair’s upside momentum to 0.6700 round-figure seems most likely. However, 200-D EMA level of 0.6719 and the recent high around 0.6730 could challenge its additional rise.
Given the price rally beyond 0.6730, chances of bulls targeting mid-April top close to 0.6785 can’t be denied.
On the downside, 23.6% Fibonacci retracement of recent up-moves and aforementioned support-line can challenge sellers around 0.6670/67, a break of which can quickly fetch the pair to 38.2% Fibonacci retracement of 0.6634.
In a case where bears keep dominating below 0.6634, 200-bar moving average (4H 200MA) and 61.8% Fibonacci retracement confluence region at 0.6577/75 becomes the key.
NZD/USD 4-hour chart
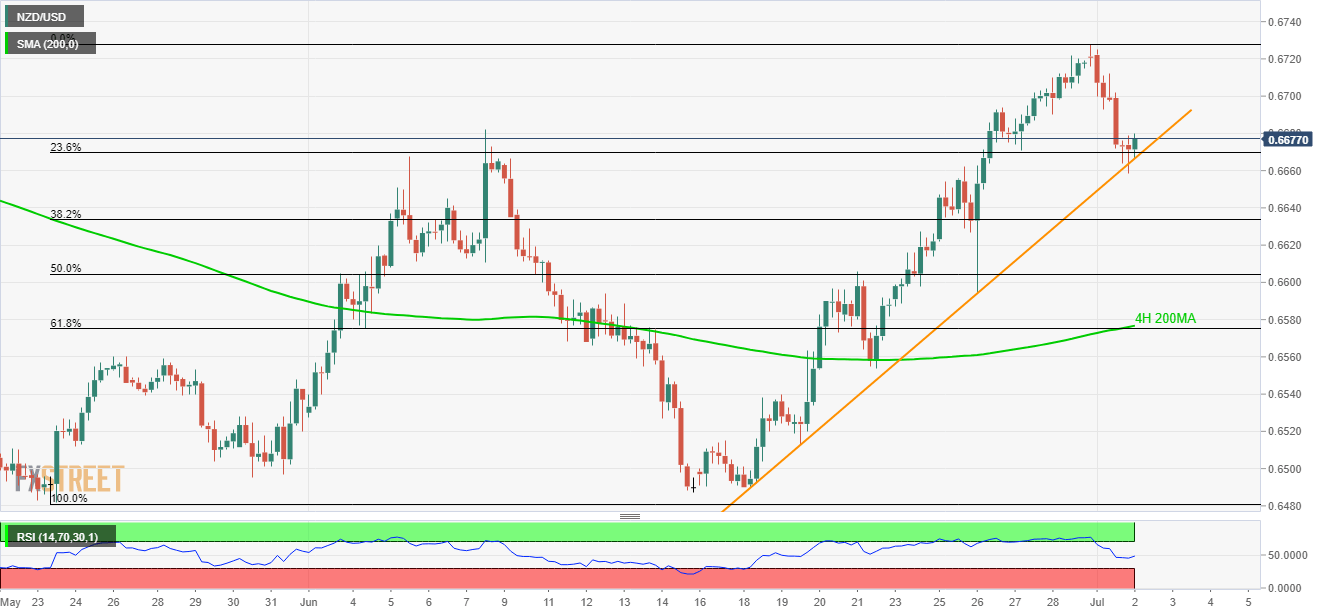
Trend: Bullish
