- This Wednesday, the AUD/USD hit its highest point since May.
- To the upside, resistances are seen at 0.7050 followed by 0.7090.
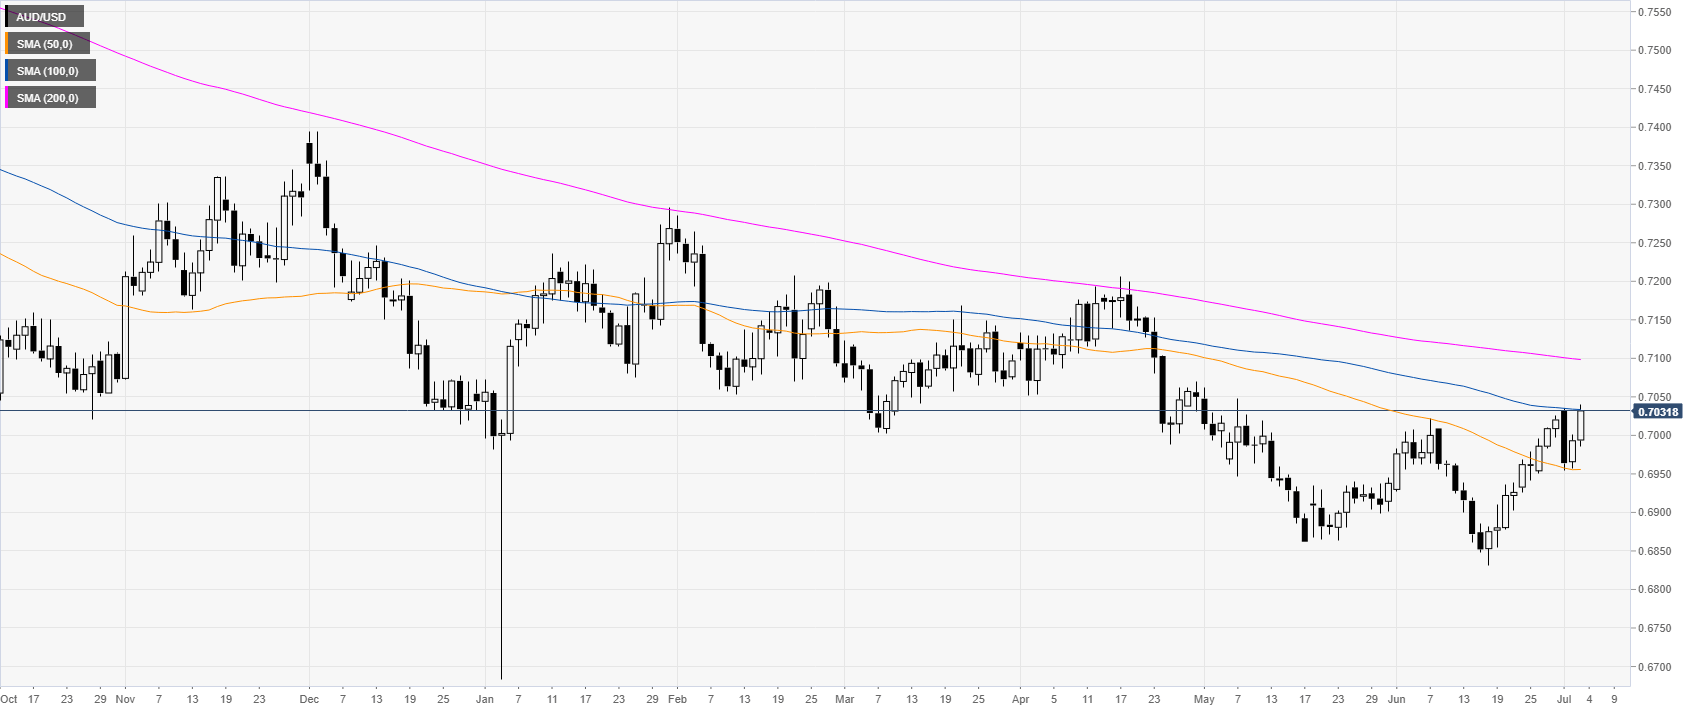
AUD/USD daily chart
The Aussie is trading in a bull leg since mid-June. AUD/USD is testing the 100 DSMA while trading below the 200-day simple moving averages (DSMAs).
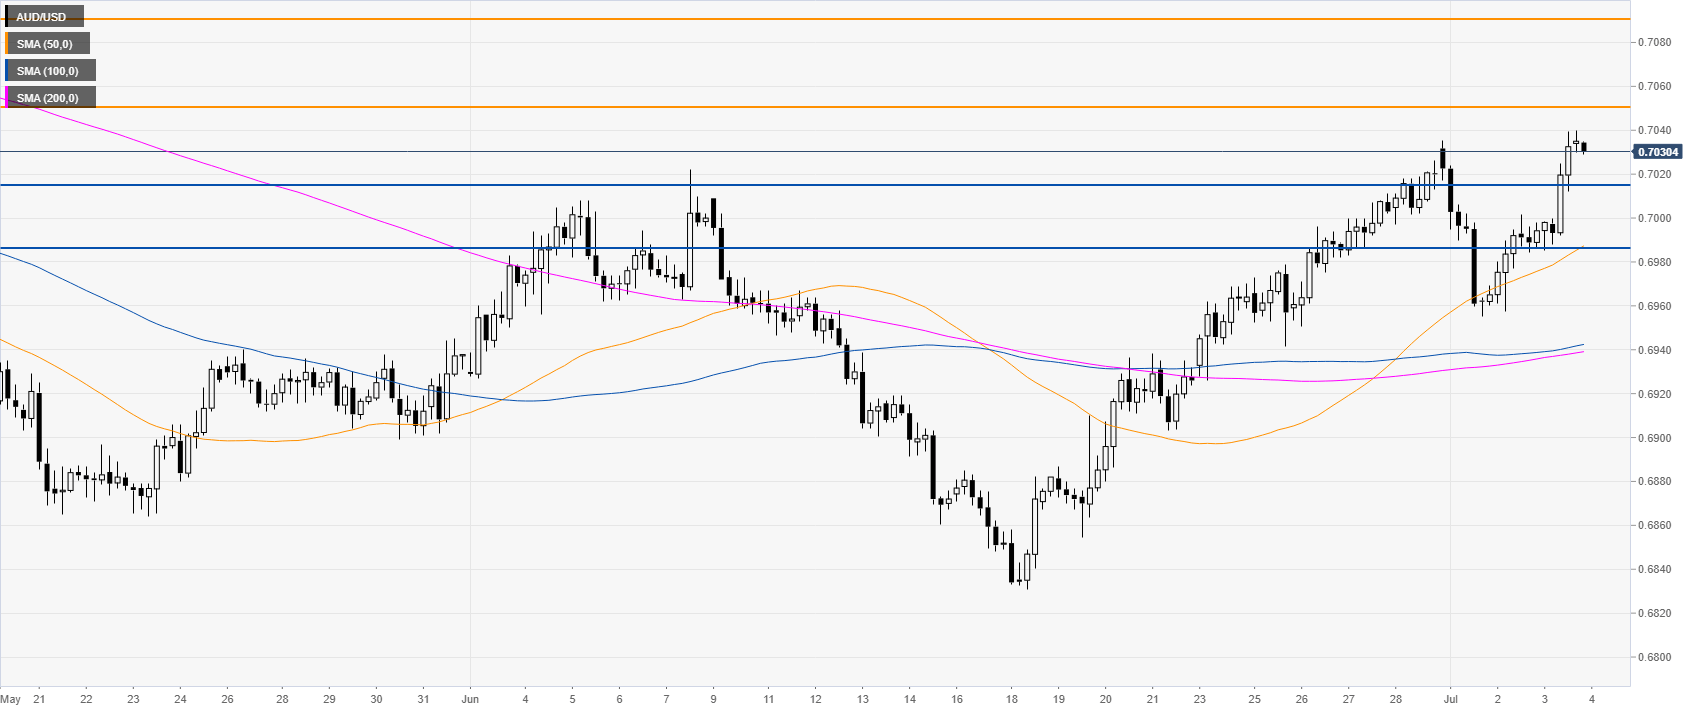
AUD/USD 4-hour chart
The Aussie is trading above its main SMAs suggesting bullish momentum. If the market breaks above 0.7050 the next resistance might be located near 0.7090, according to the Technical Confluences Indicator.
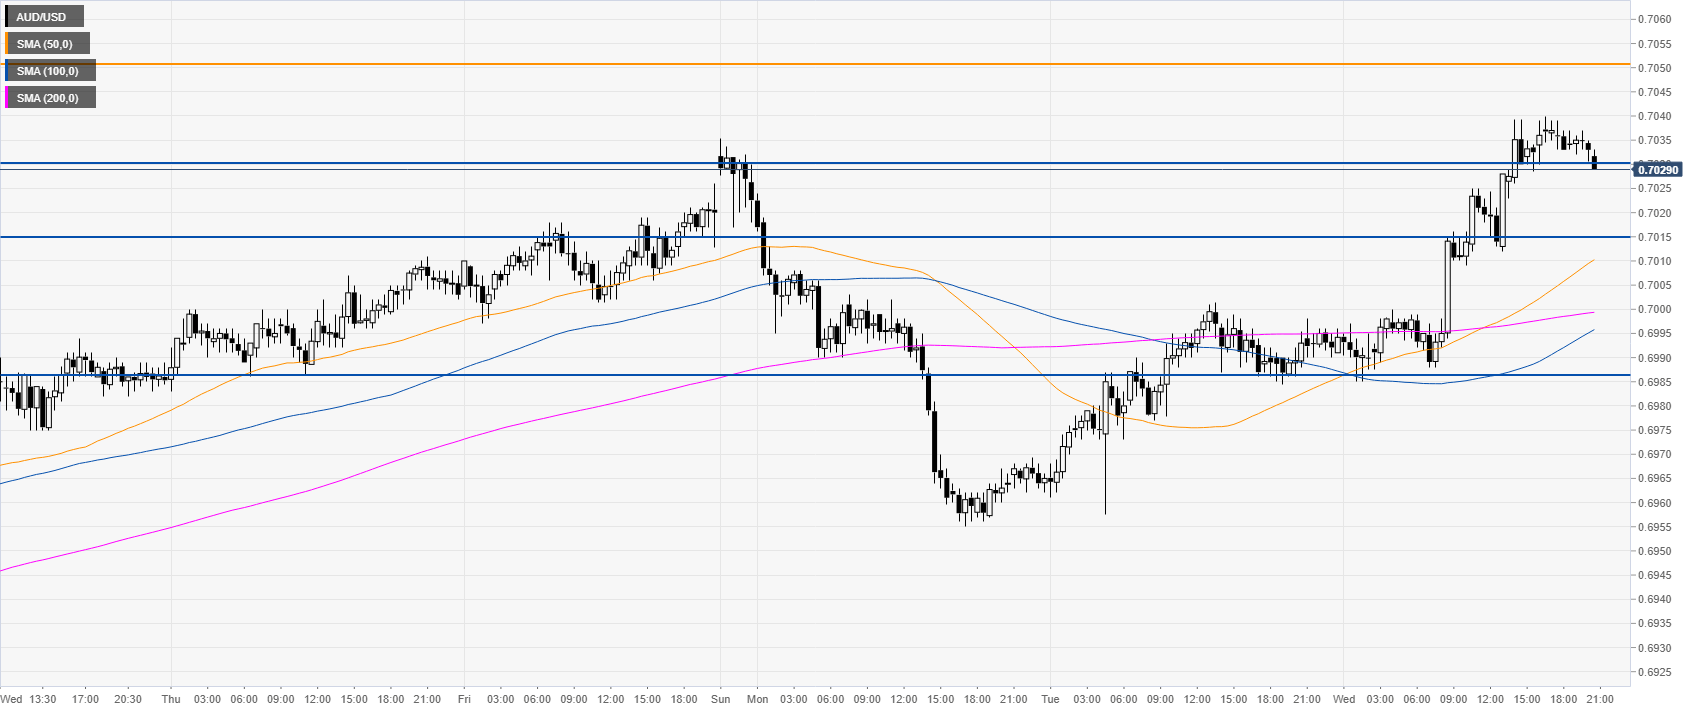
AUD/USD 30-minute chart
AUD/USD is trading above its main SMAs suggesting bullish momentum in the near term. The market is currently retracing and trying to break below 0.7030 support. A sustained below the level send the currency pair towards 0.7015 support, according to the Technical Confluences Indicator.
Additional key levels
