- DXY keeps a bullish bias above its 200 DSMA.
- The level to beat for bulls is at the 97.00 and 97.30 levels.
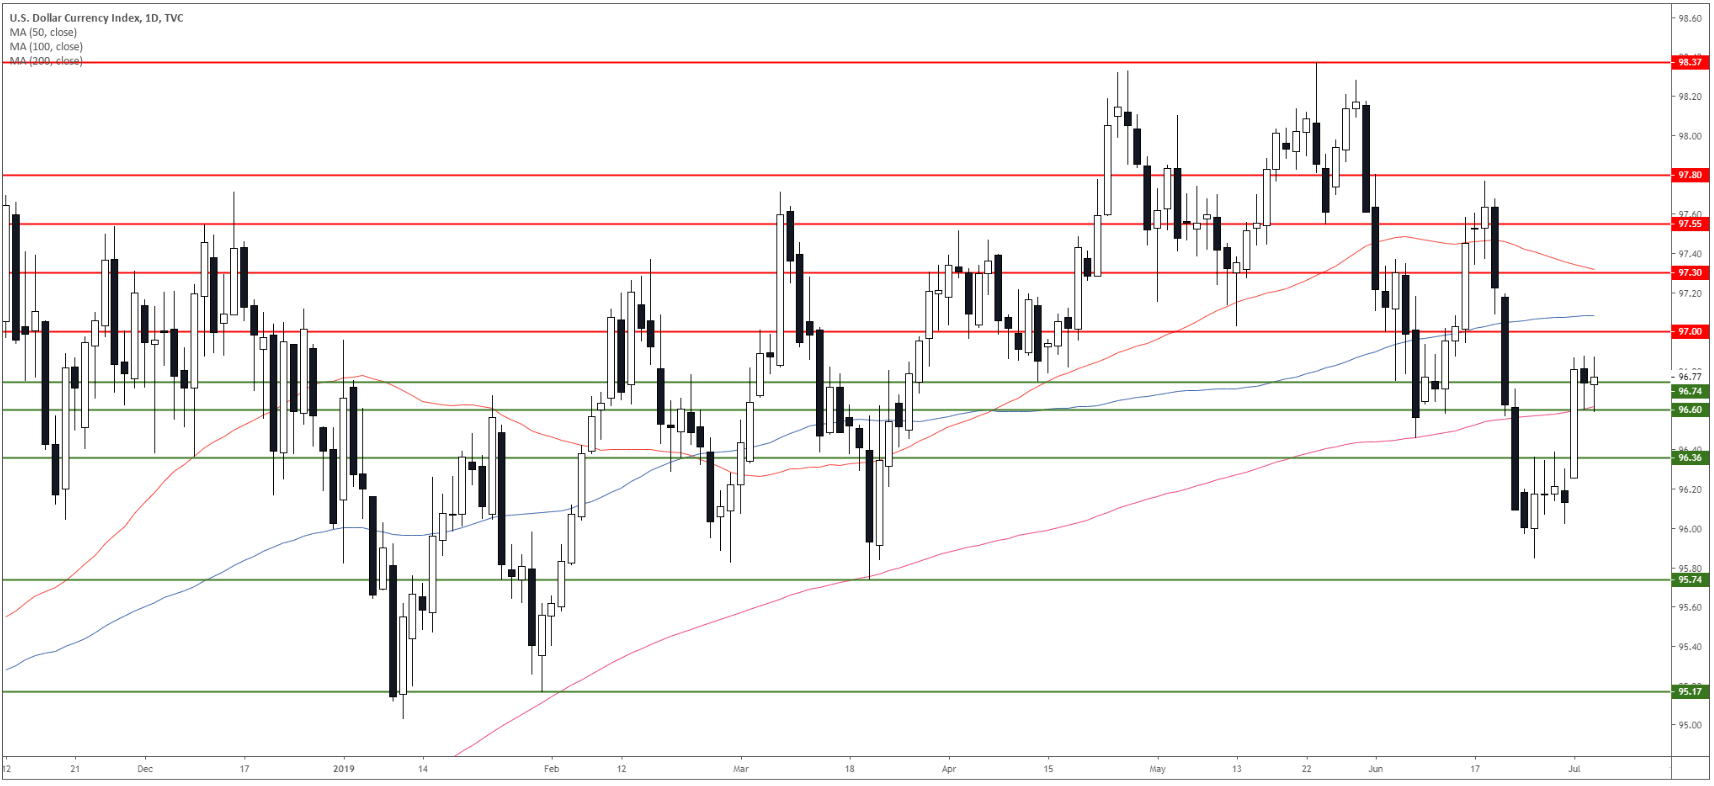
DXY daily chart
The US Dollar Index (DXY) is holding just above 96.60 support and the 200-day simple moving average (DSMA). Bulls would ideally need to surpass the 97.00 figure to get out of the woods.
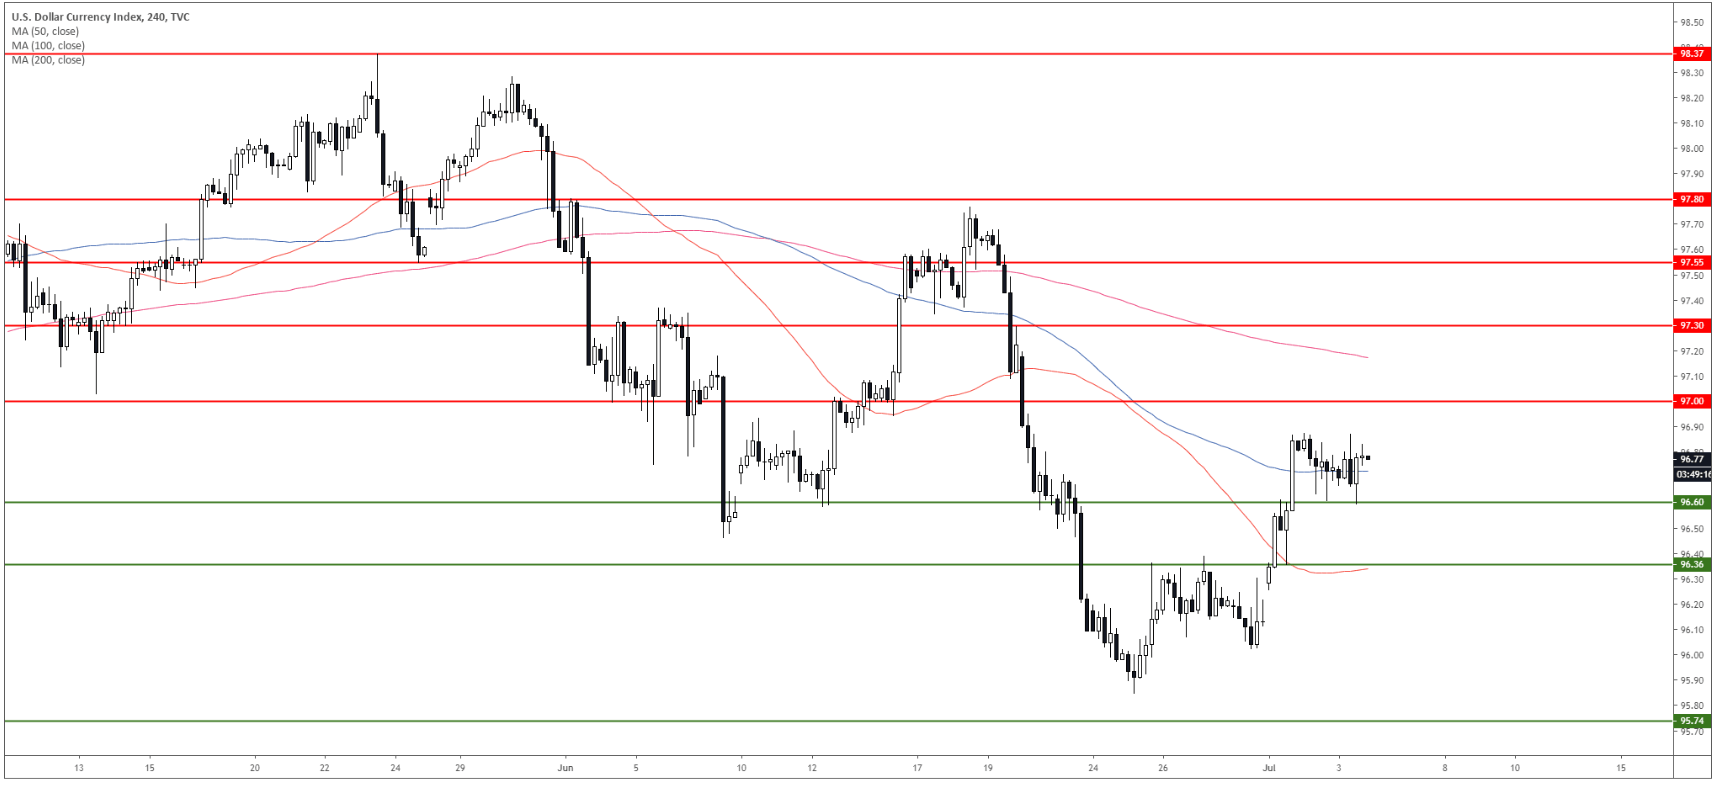
DXY 4-hour chart
DXY keeps coiling around the 100 SMA. Buyers would need to break 97.00 resistance to potentially reach 97.30 to the upside.
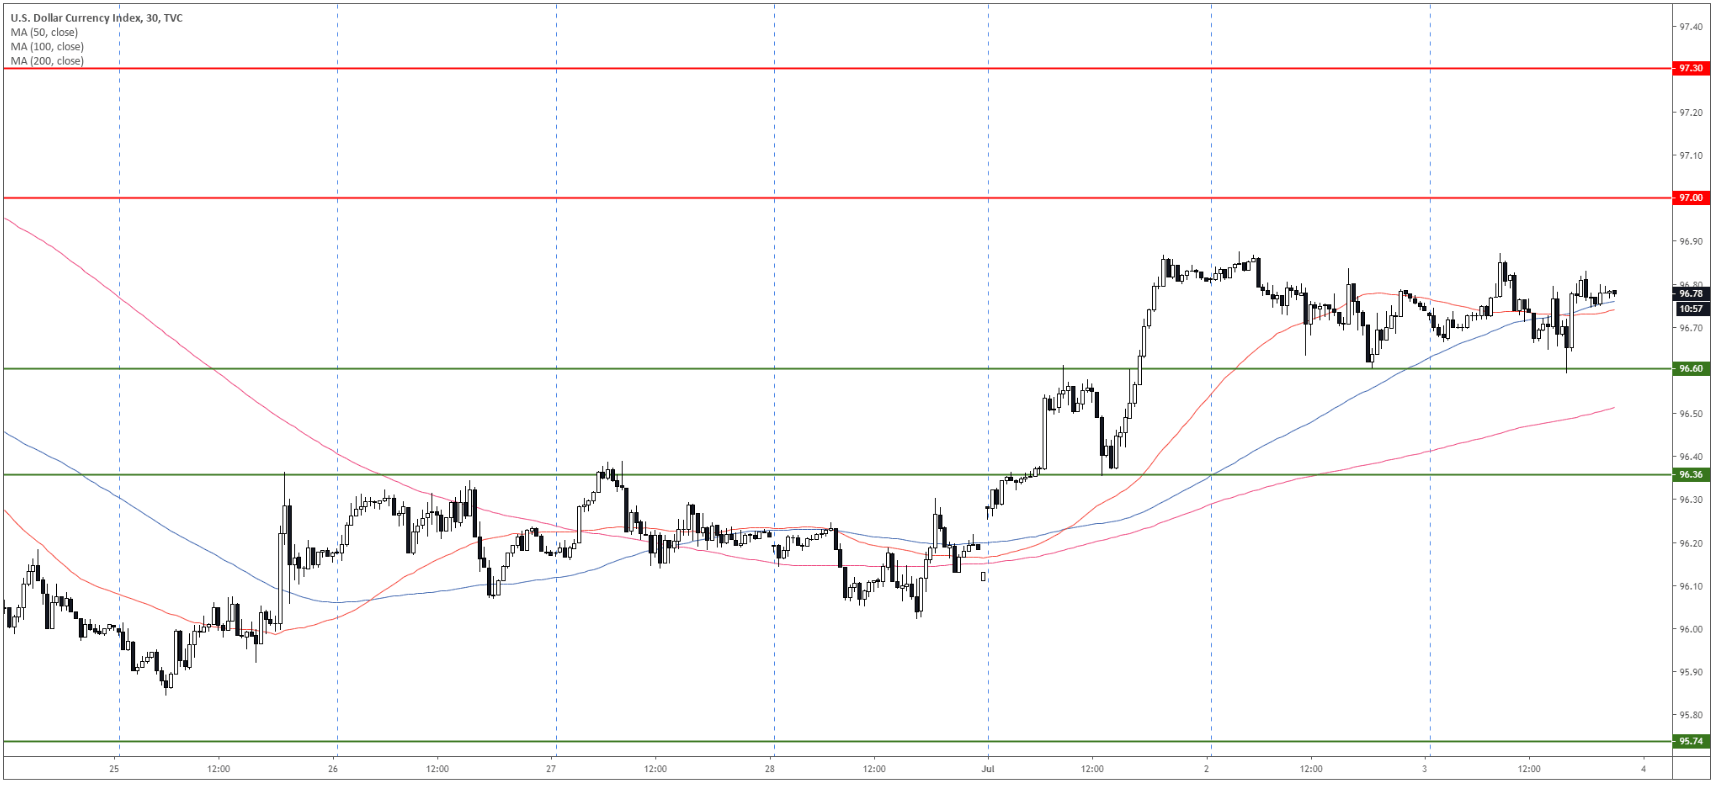
DXY 30-minute chart
The market is currently bullish above its main SMAs. On the way down, support is seen at 96.60 and 96.36. A break below 96.36 on a daily basis could negate the bullish bias.
Additional key levels
