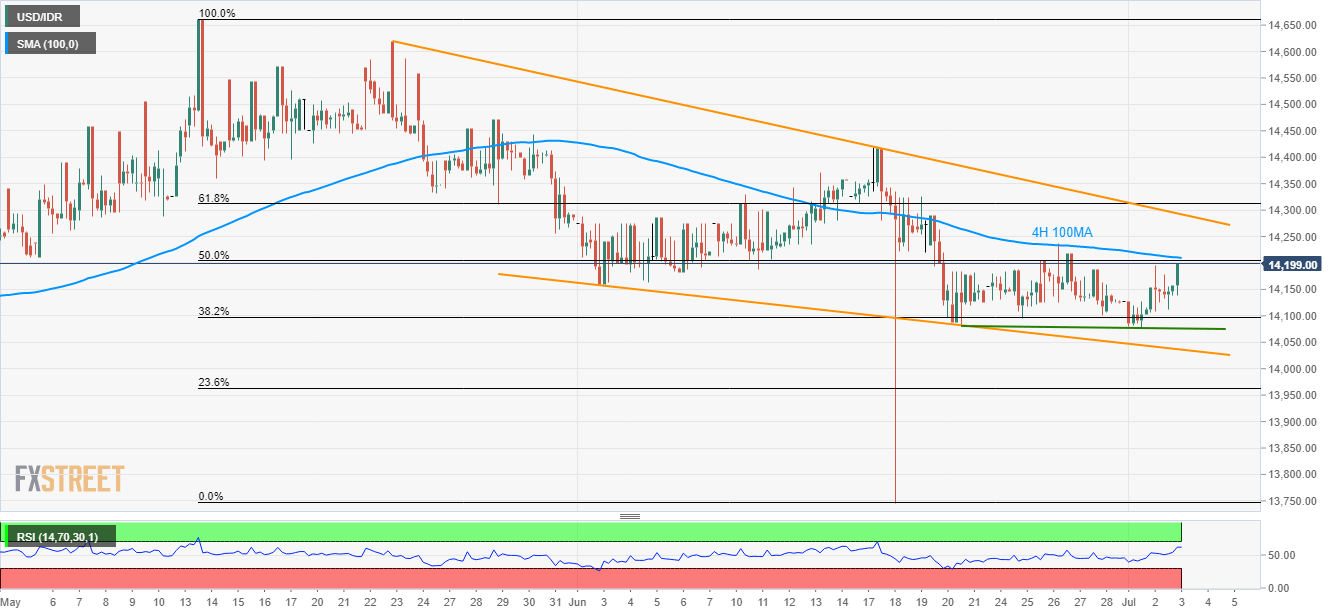
- 14,205/11 confluence region limits USD/IDR recovery from 13-day old horizontal support.
- An upside clearance of 14,294 can challenge June month top.
- Overbought RSI conditions question the buyers.
Despite gradually recovering from short-term horizontal support, the USD/IDR pair needs to cross immediate resistance-confluence to justify its strength as it takes the bids near 14,200 during early Wednesday.
The 100-bar moving average on the 4-hour chart (4H 100MA) and 50% Fibonacci retracement of latest downpour confine the pair’s upside around 14,205/11, a break of which can quickly propel the quote to 5-week long descending resistance-line, forming part of the falling wedge, at 14,294 now.
Even if 14-bar relative strength index (RSI) indicates near overbought conditions, pair’s rally beyond 14,294 might not refrain from question June month high of 14,418.
Meanwhile, 14,100 and a horizontal-line near 14,075 can offer immediate support to the pair ahead of dragging it to bullish formation support of 14,037.
Should prices decline below 14,037, the technical pattern’s rejection could divert sellers to sub-14,000 area.
USD/IDR 4-hour chart
Trend: Pullback expected
