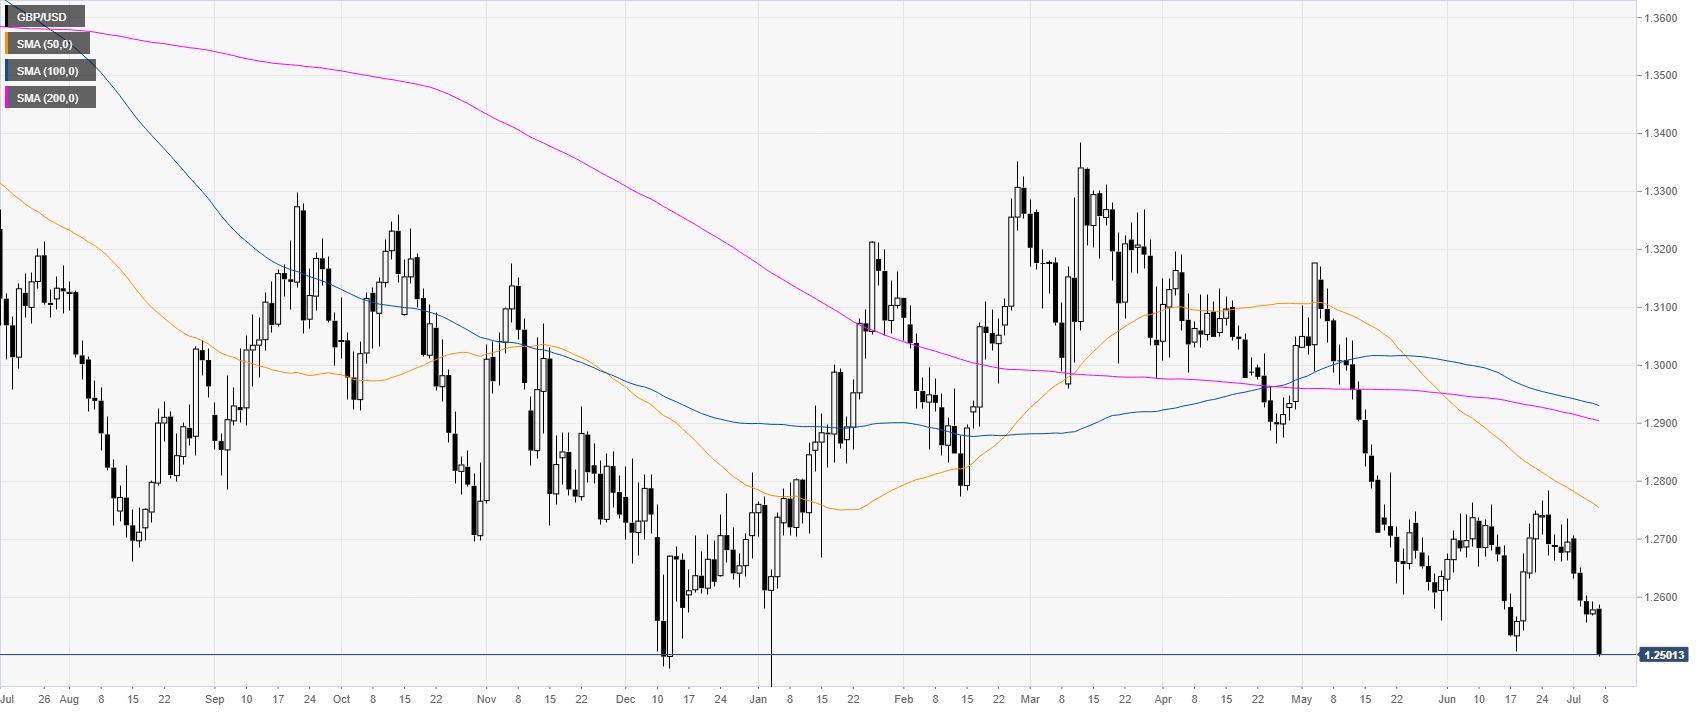
- GBP/USD is dropping following the better-than-expected NFP report.
- Cable is challenging the 1.2500 figure as the USD is gathering steam.
GBP/USD daily chart
GBP/USD is trading in a bear trend below its main daily simple moving averages (DSMAs). The market is now challenging the 1.2500 figure. Cable is falling after the release of the June’s Nonfarm Payrolls (NFP). The US added 224K jobs vs. 160K expected. The wages came in line with expectations.
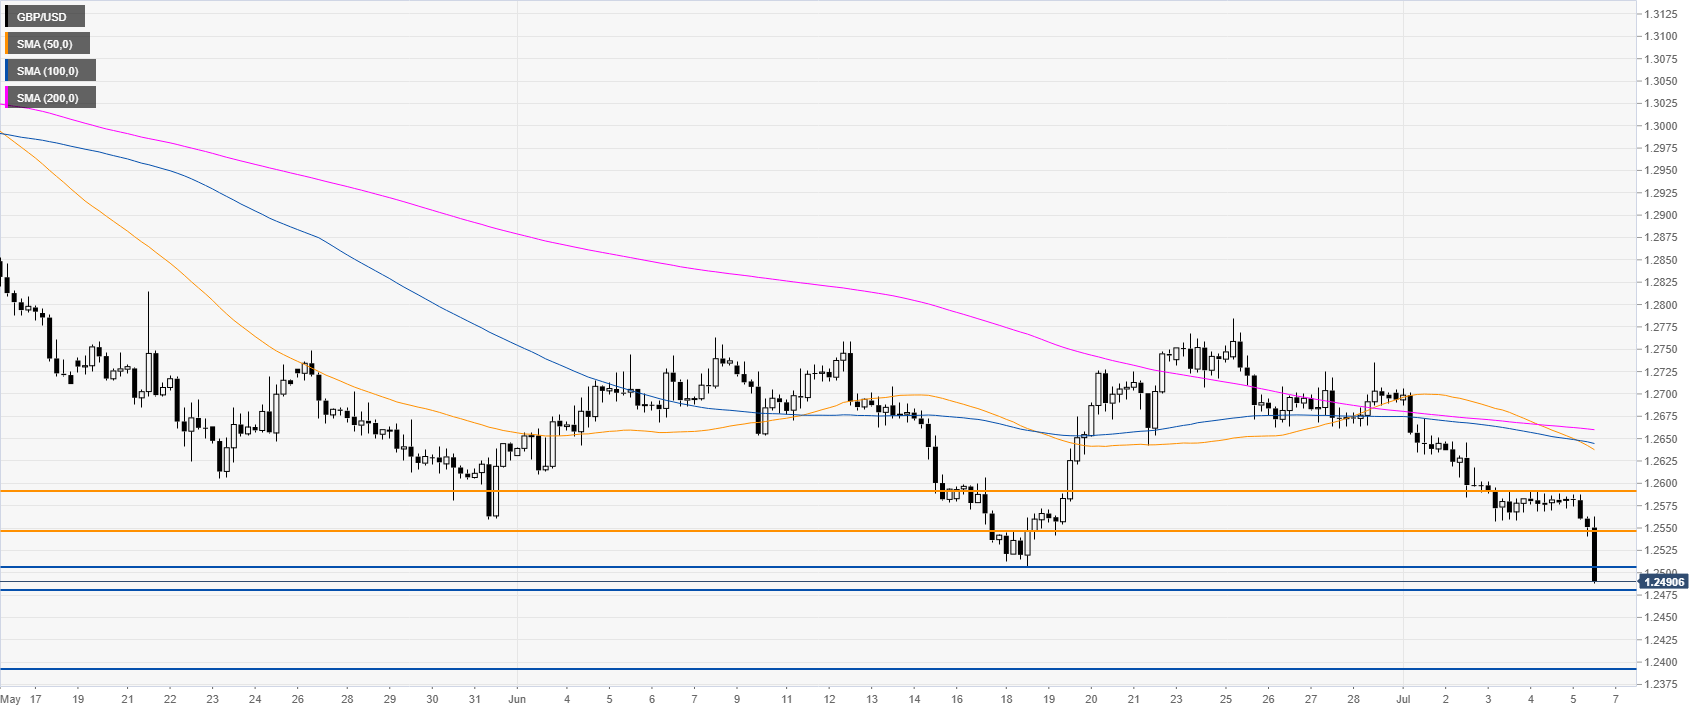
GBP/USD 4-hour chart
If the market closes below 1.2506, the sellers could push the currency pair to 1.2480 and 1.2390 according to the Technical Confluences Indicator.

GBP/USD 30-minute chart
GBP/USD is under strong selling pressure below its main SMAs suggesting bearish momentum in the short term. Resistances are seen at 1.2506 and 1.2546, according to the Technical Confluences Indicator.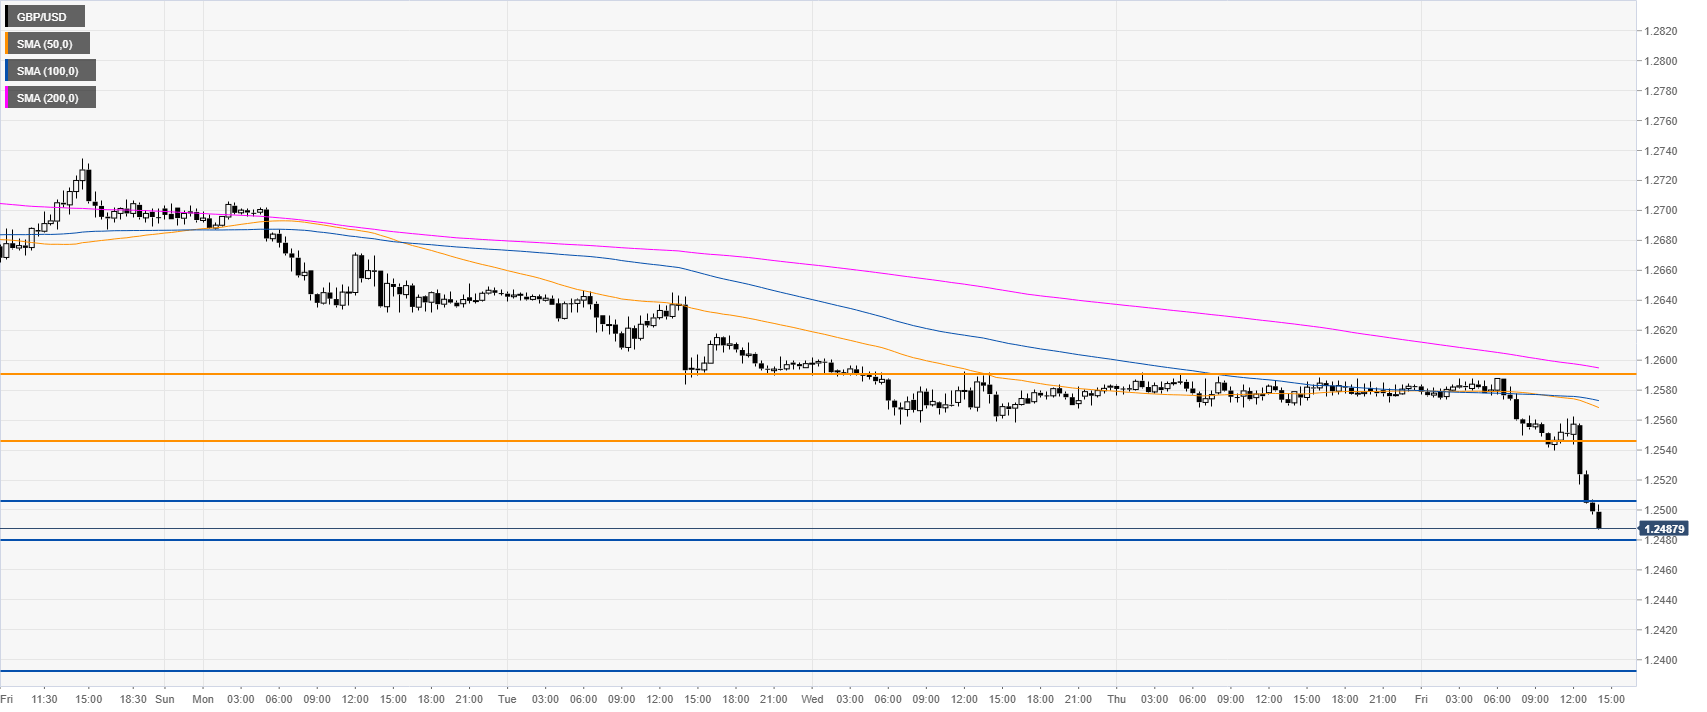
Additional key levels
