- 14,080/78 limits the USD/IDR pair’s downside.
- 4H 100MA, near-term descending trend-line restrict the quote’s advances.
USD/IDR’s repeated bounces off 14,080/78 support-zone again confront near-term key resistance as it trades close to 14,150 amid initial Asian session on Monday.
The 100-bar moving average on the 4-hour chart (4H 100MA) around 14,189/90 restricts the pair’s immediate upside, a break of which can propel the quote towards 6-week old descending resistance-line, at 14,260.
Given the pair’s sustained trading beyond 14,260, 61.8% Fibonacci retracement of April-June downpour, at 14,346, followed by mid-June high around 14,420, can lure the buyers.
Alternatively, pair’s dip beneath 14,078 can avail 14,000 round-figure as intermediate halt prior to visiting 23.6% Fibonacci retracement level of 13,974.
USD/IDR 4-hour chart
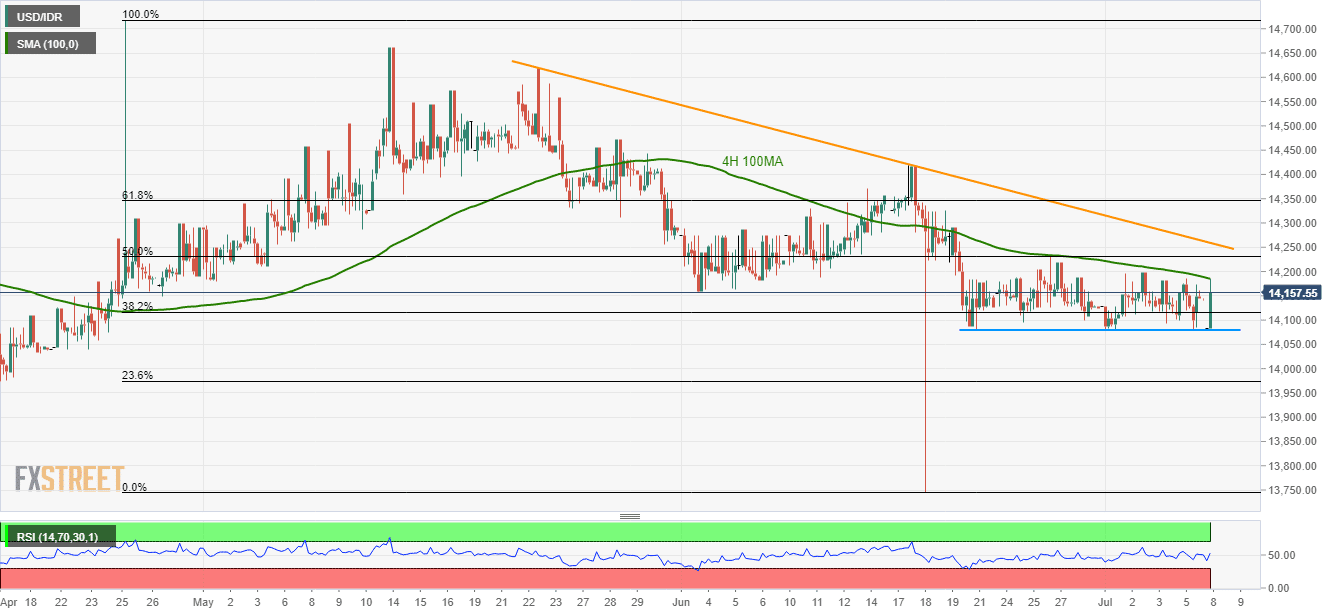
Trend: Sideways
