- GBP/USD leaped above 1.2500 Fed’s Powell remarks.
- Investors are waiting for the FOMC minutes at 18.00 GMT.
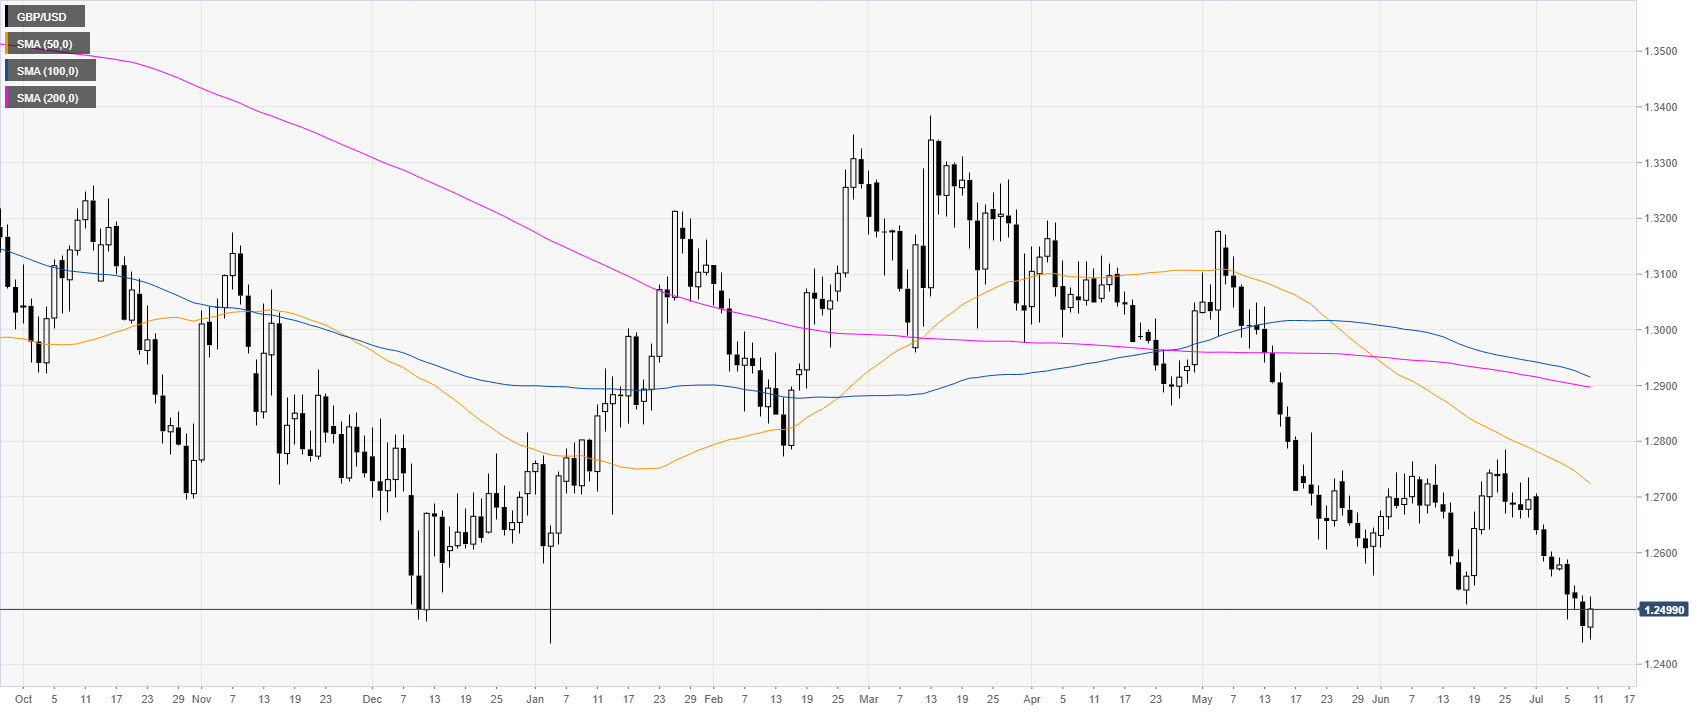
GBP/USD daily chart
GBP/USD is trading in a bear trend below its main daily simple moving averages (DSMAs). The market has tested Tuesday’s highs after dovish remarks from Fed’s Powell.
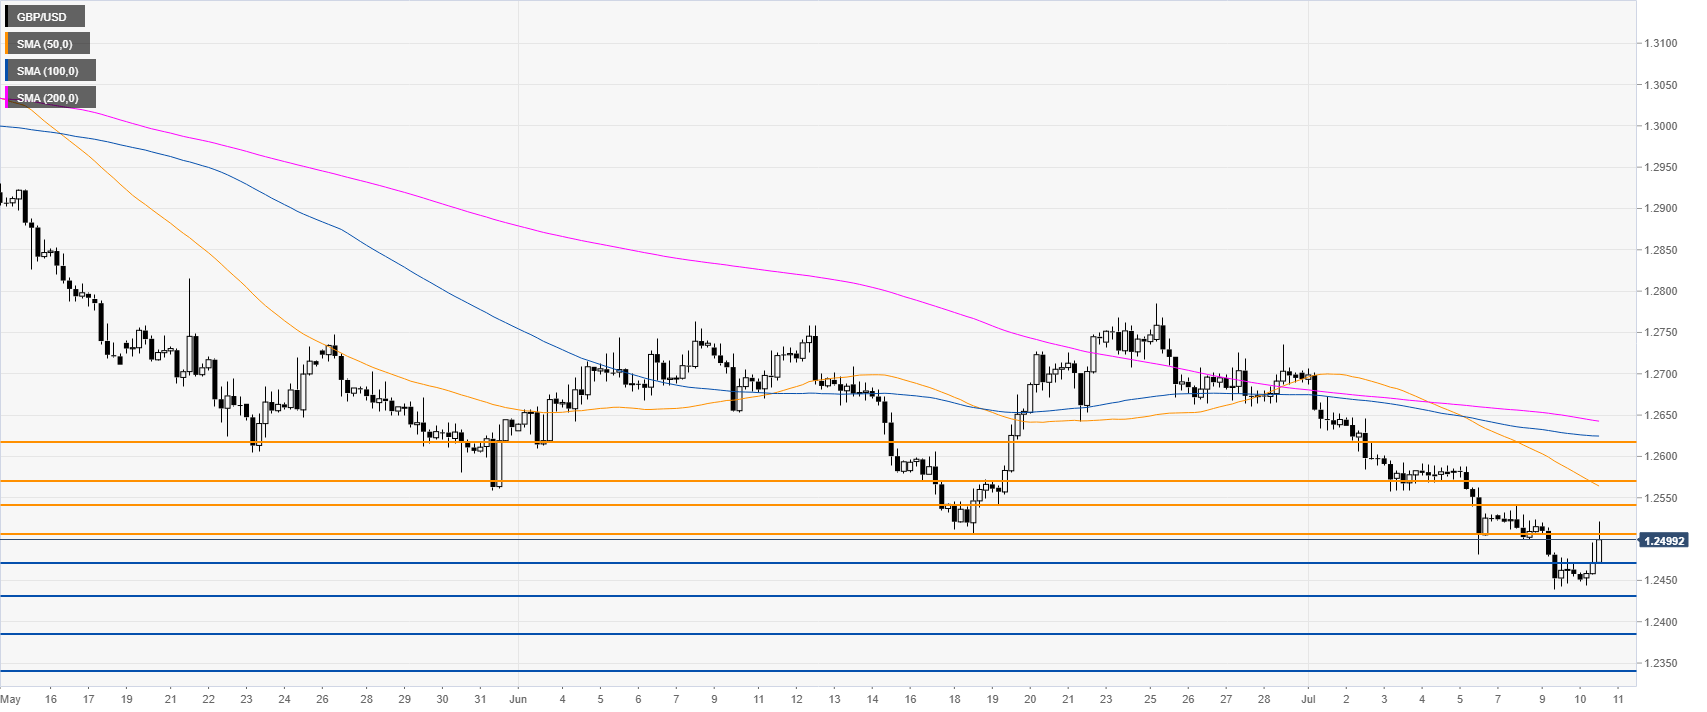
GBP/USD 4-hour chart
GBP/USD rose to the 1.2505 resistance as the market trades below its main SMAs. Further up lies 1.2540 and 1.2570 resistances, according to the Technical Confluences Indicator.
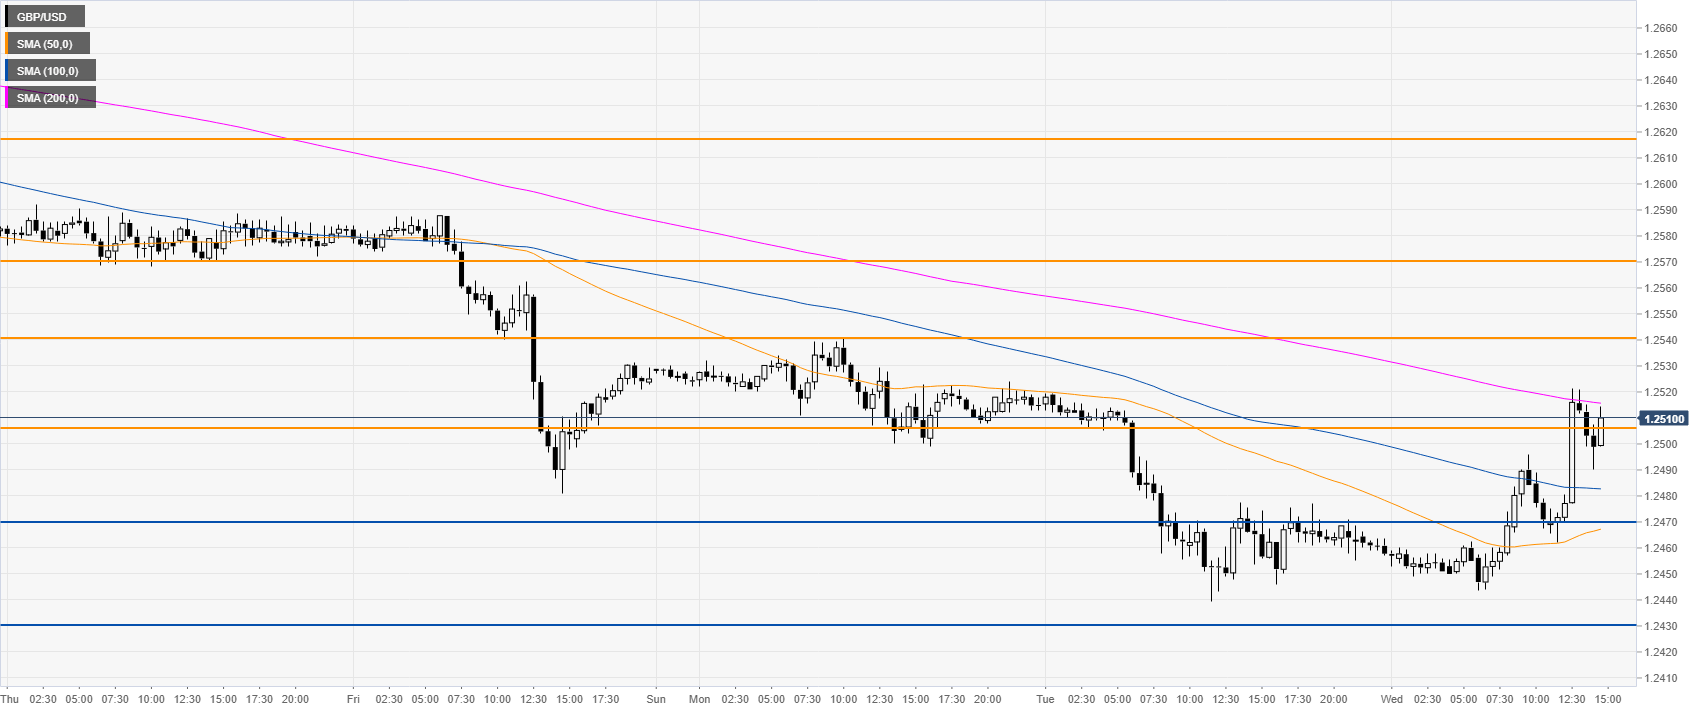
GBP/USD 30-minute chart
GBP/USD is trading above the 50 and 100 SMA suggesting a consolidation in the near term, support can be seen near the 1.2470 and 1.2430 levels, according to the Technical Confluences Indicator.
Additional key levels
