- USD is down across the board on dovish remark from Fed’s Powell.
- Investors will be paying close attention to the FOMC minutes at 18.00 GMT
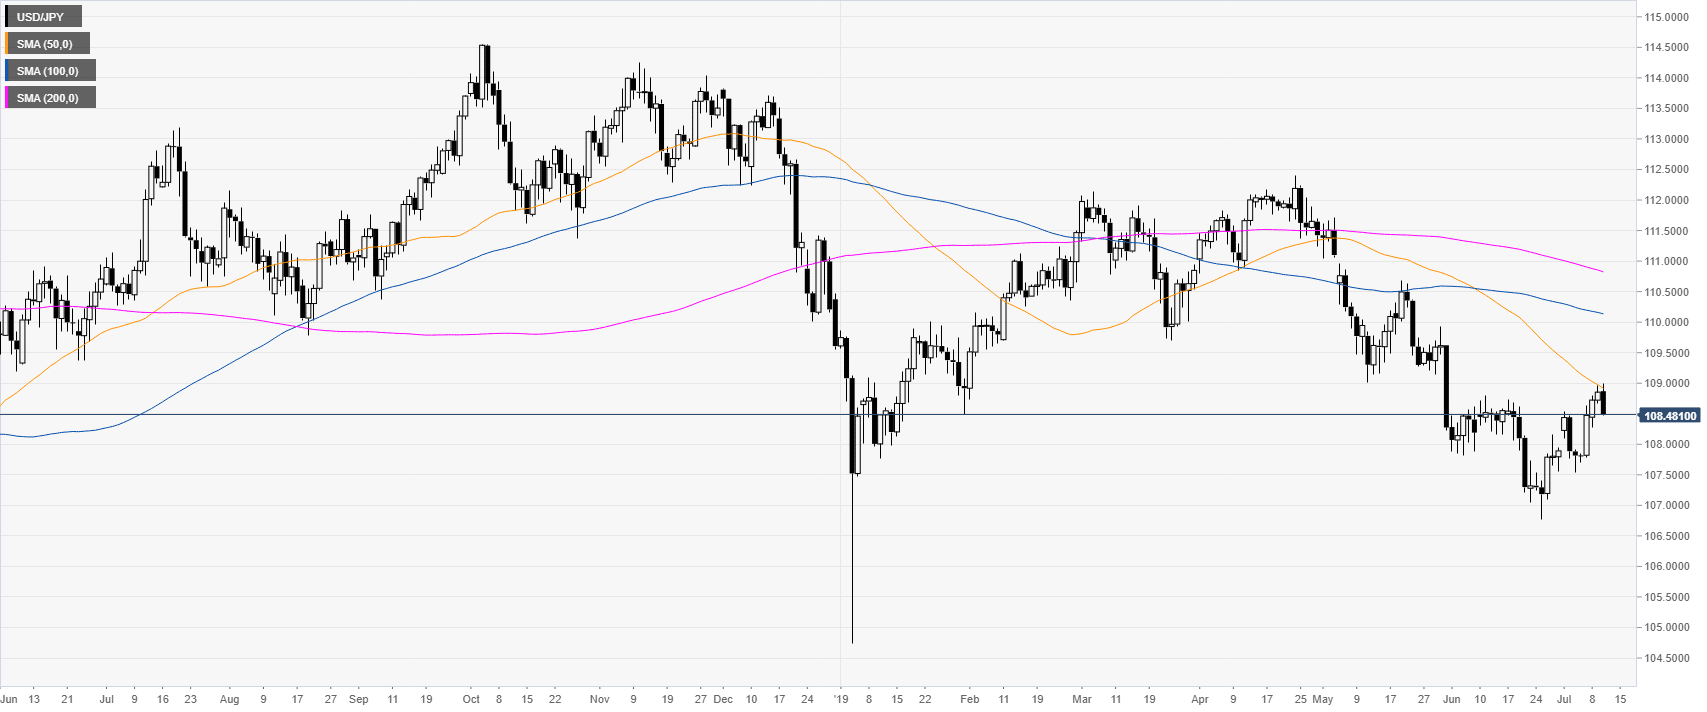
USD/JPY daily chart
USD/JPY is trading down sharply after hitting the 109.00 figure and the 50-day simple moving average (DSMA).
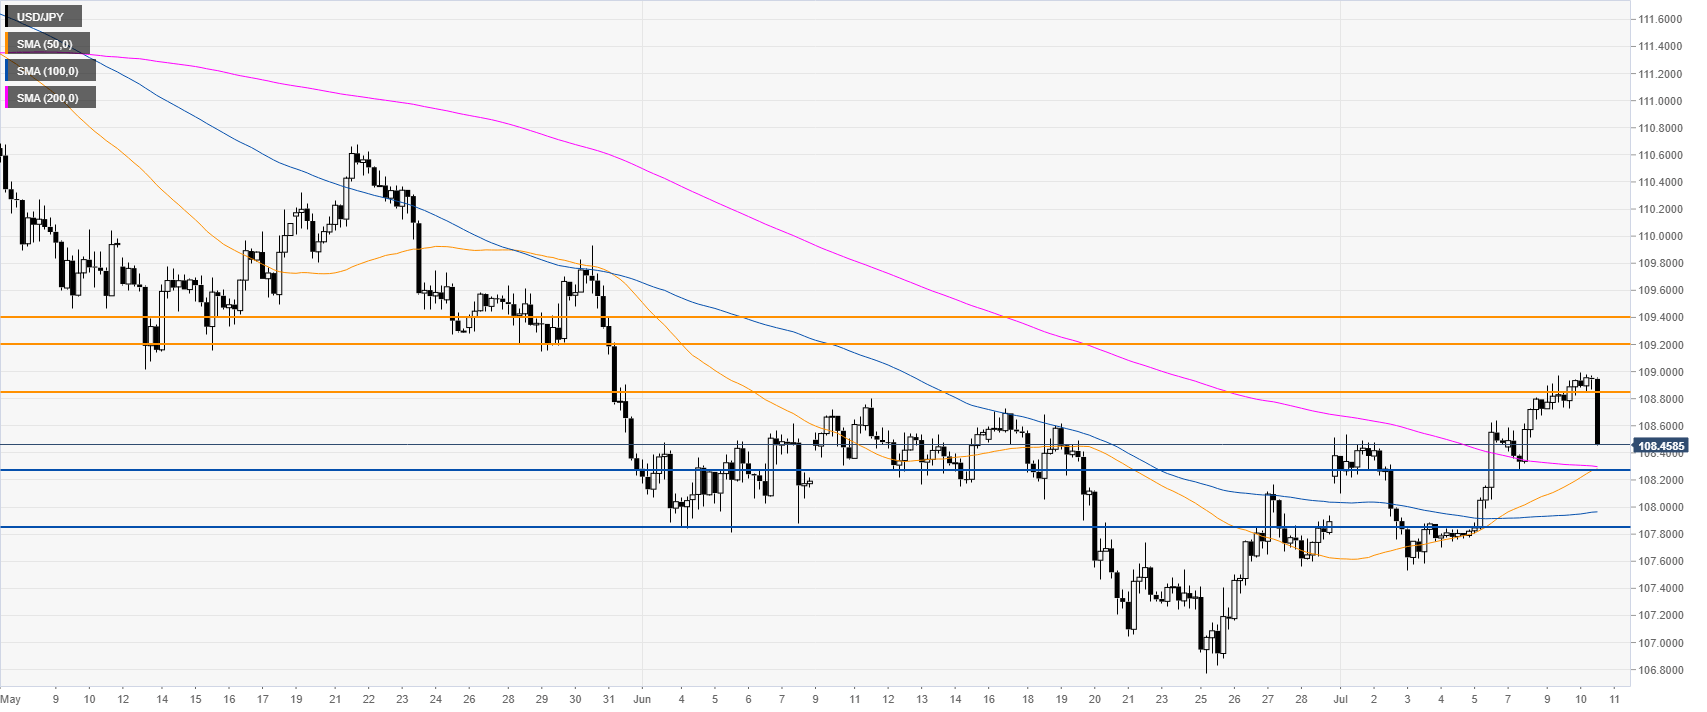
USD/JPY 4-hour chart
The market is retracing down towards 108.25 support. Further down lies 107.85, according to the Technical Confluences Indicator.
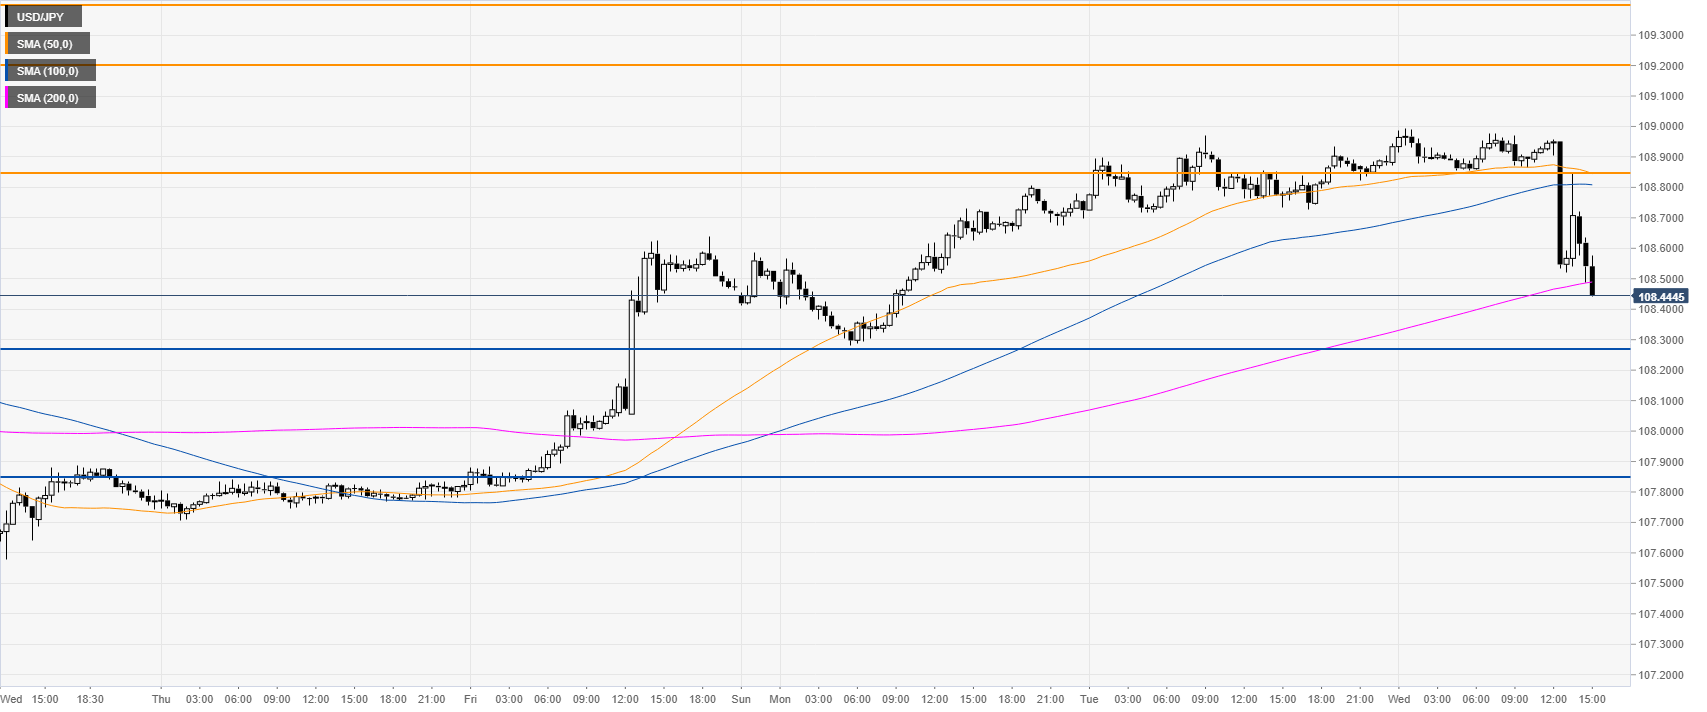
USD/JPY 30-minute chart
USD/JPY is attempting to beak below its main SMAs suggesting potential bearish momentum in the short term. Immediate resistances can be seen at 108.85 and 109.20, according to the Technical Confluences Indicator.

Additional key levels