- DXY is trading near the daily lows below the 97.00 handle.
- A break below 96.80 support caould lead to more down.
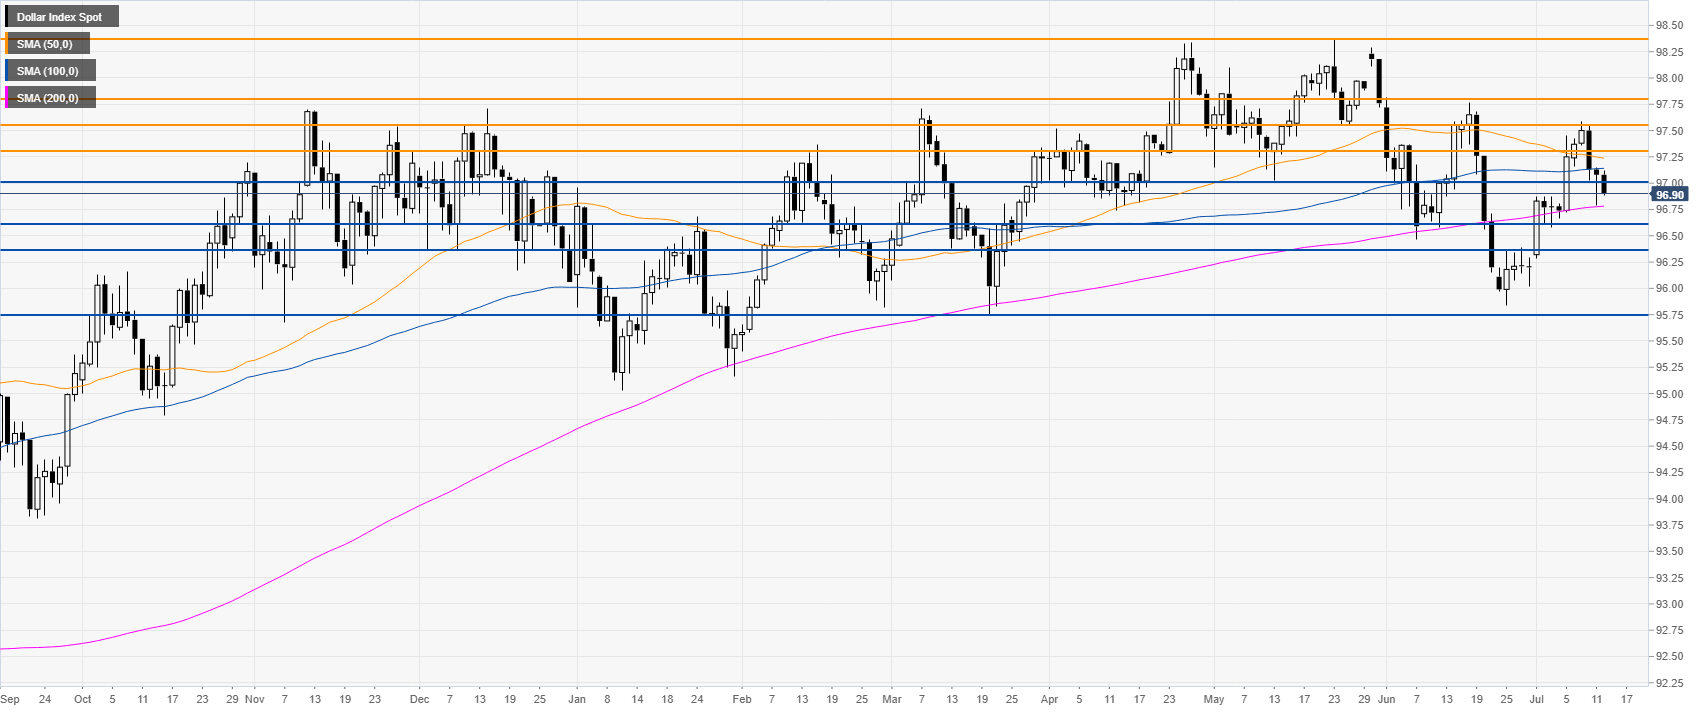
DXY daily chart
The US Dollar Index (DXY) is trading in a bull trend above the 200-day simple moving average (DSMA). DXY is trading at daily lows.
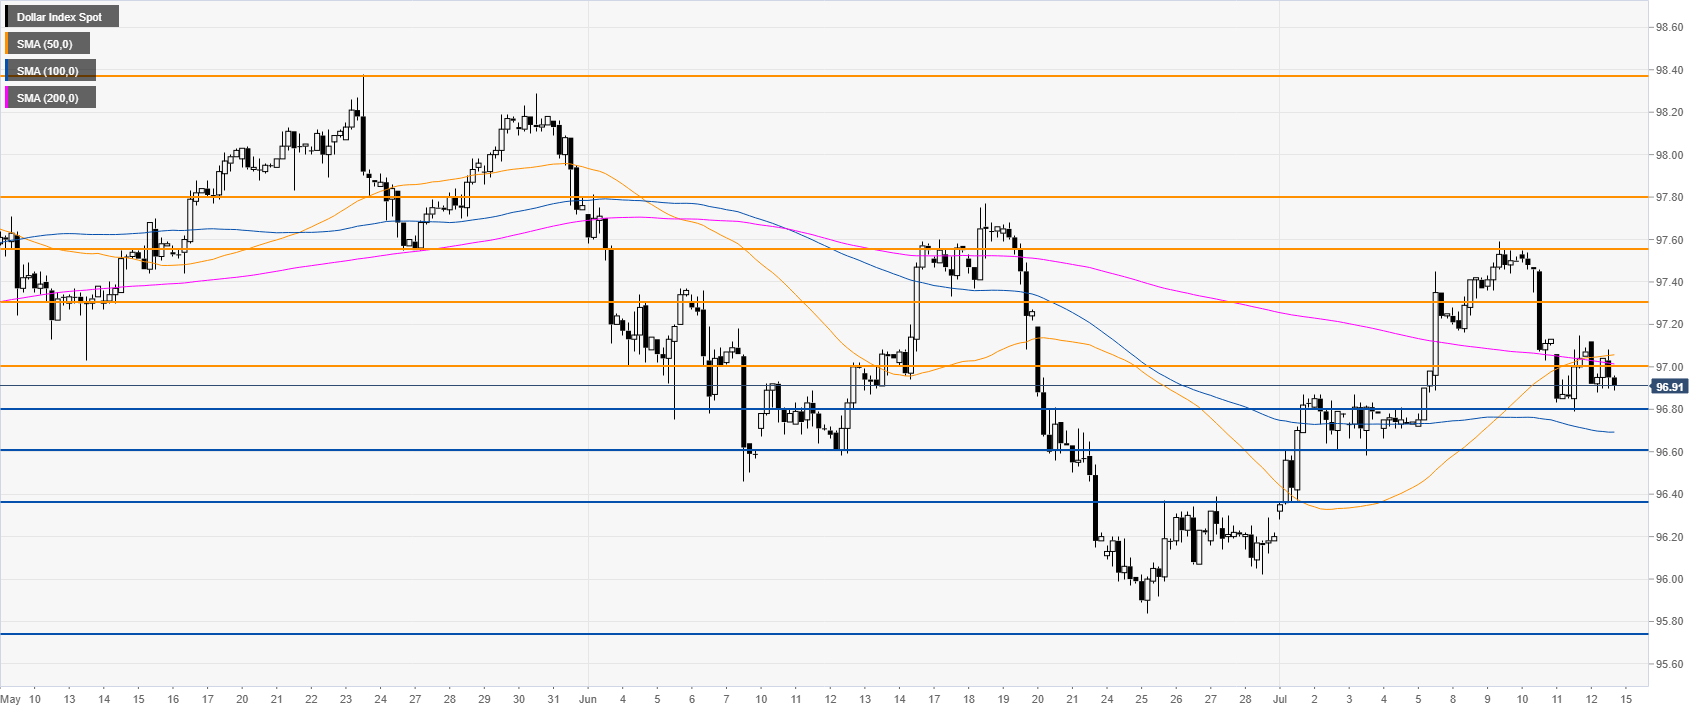
DXY 4-hour chart
The market is under bearish pressure below the 97.00 handle and the 50/200 SMA. A breach below 96.80 could lead to 96.60 and 96.37.
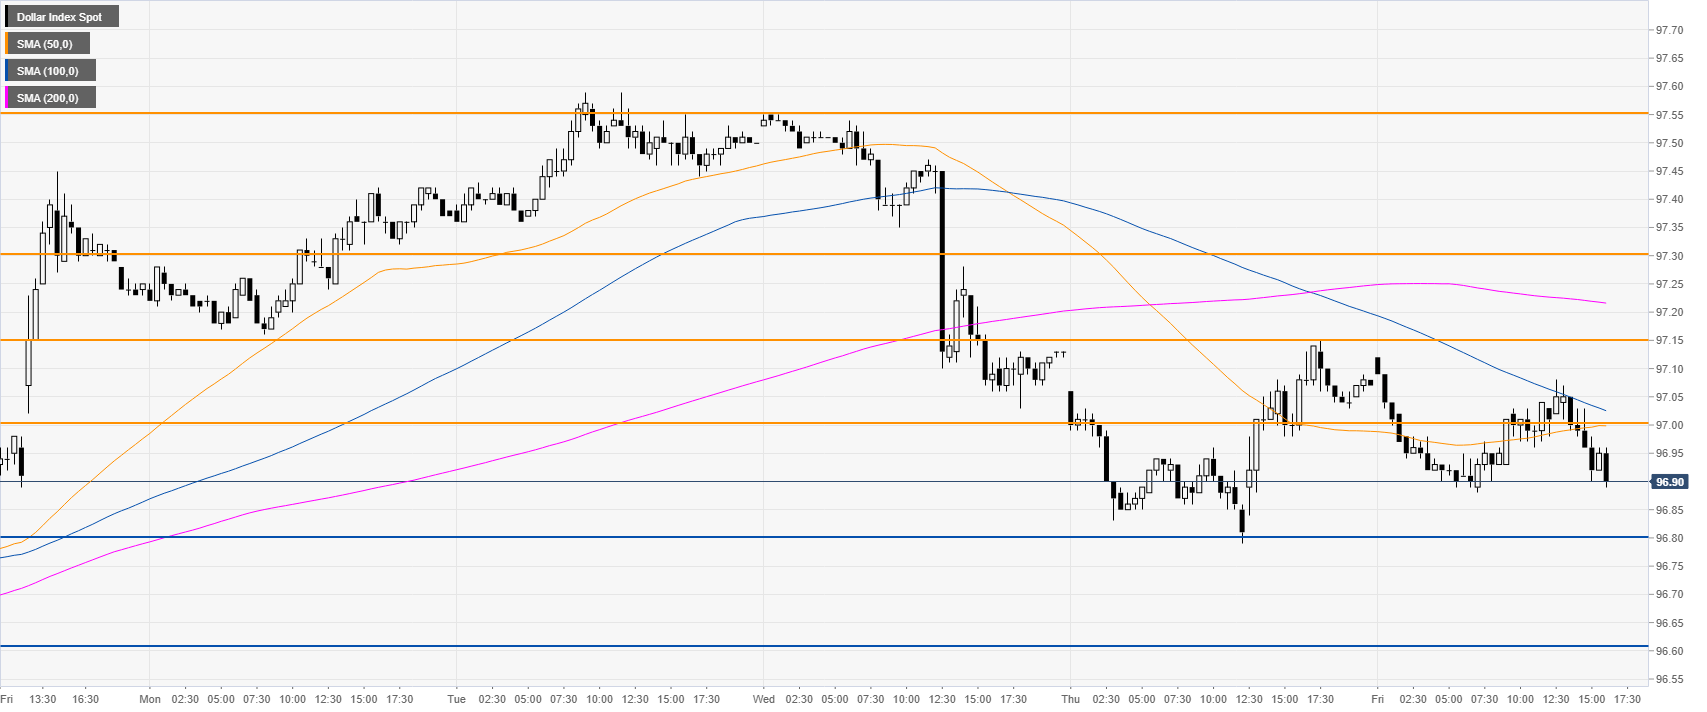
DXY 30-minute chart
DXY is trading below its main SMAs suggesting bearish momentum in the near term. Immediate resistances are seen at 97.00 and 97.15.
Additioinal key levels
