- Recent high, 50% Fibonacci retracement and 4H 200MA can limit the USD/IDR pair’s latest recovery ahead of confirming short-term falling wedge.
- Formation support around 14,000 holds the key to pair’s additional weakness.
Despite recovering from 14,040, USD/IDR is far from being strong as many key resistances stand tall to challenge the pair’s recovery as it takes the rounds to 14,128 during early Friday.
The first one to grab buyers’ attention will be 14,165, followed by 50% Fibonacci retracement of May-June downpour at 14,204.
During the quote’s additional upside past-14,204, 200-bar moving average (4H 200MA) and the resistance-line of an immediate falling wedge technical pattern, around 14,212/20, can question buyers.
Alternatively, formation support close to 14,000 round-figure can limit the pair’s near-term declines below 14,040.
USD/IDR daily chart
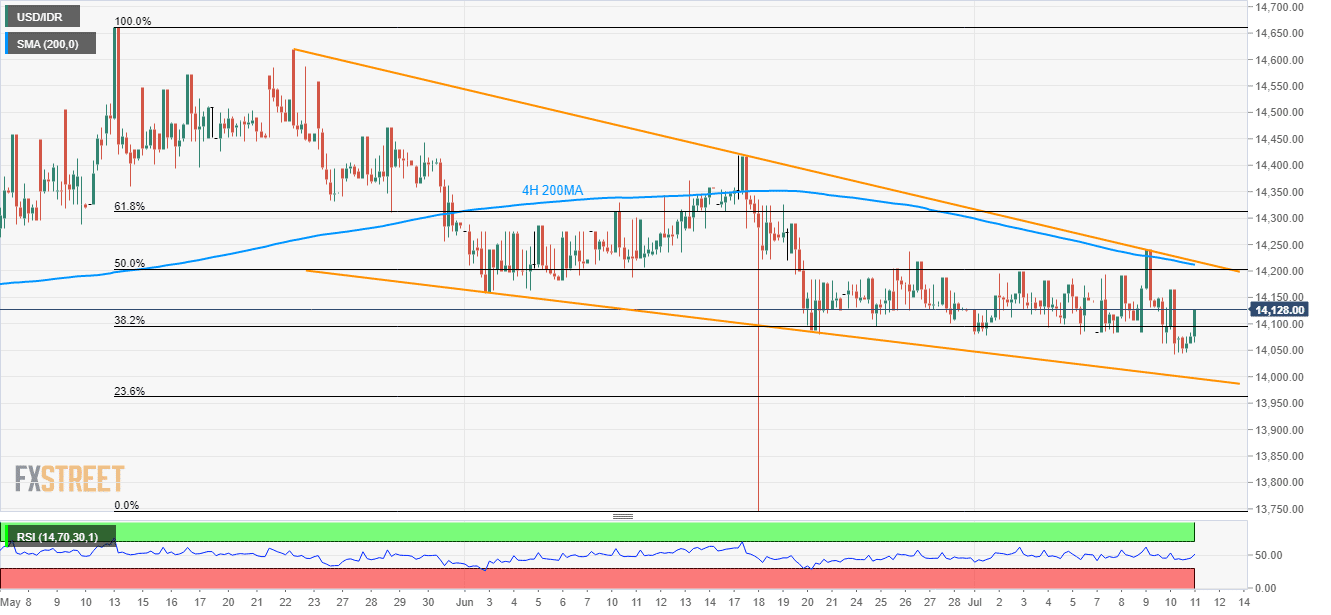
Trend: Pullback expected
