- Lower high formation portrays Gold’s near-term weakness.
- Sustained trading beyond immediate ascending support-line and 100-HMA challenges the bears.
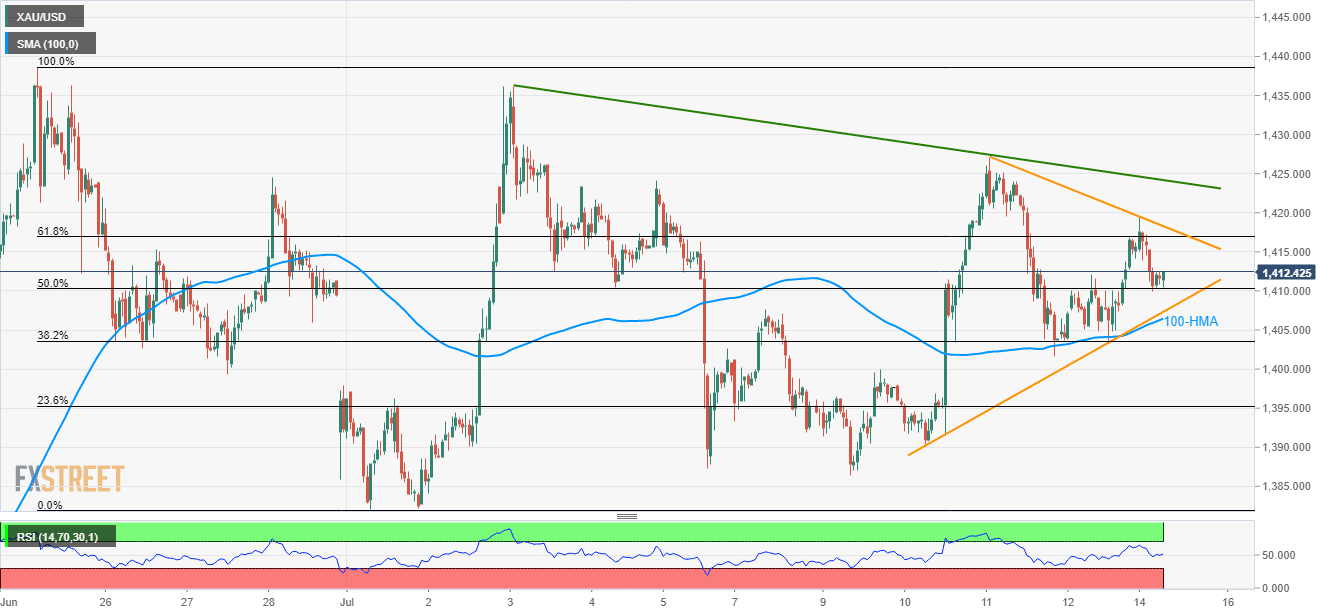
With a 5-day long triangle formation limits the yellow metal’s immediate moves, Gold prices are taking the rounds to $1,412 ahead of Europe markets open on Monday.
While U-turn from 50% Fibonacci retracement of late-June swing highs to early-July swing lows favors the quote’s rise towards 61.8% Fibonacci retracement near $14,17, short-term descending trend-line at $1418.30, followed by 12-day old downward sloping resistance-line at $1424, can question the bullion buyers.
Should bulls manage to dominate past-$1424, the latest highs surrounding $1427 and $1436 will be on their radars.
Alternatively, $1407.30/$1406.50 region comprising 100-hour moving average (HMA) and the aforementioned trend-line could restrict the safe haven’s declines.
However, extended downpour below $1406.50 can aim at $1,400 round-figure prior to highlighting $1386 and monthly bottom close to $1382 for sellers.
Gold hourly chart
Trend: Sideways
