- 4-week old descending trend-line, sustained trading below 4H 100MA portrays the USD/INR pair’s weakness.
- 68.25/18 area holds the key to pair’s plunge towards sub-68.00 region.
In addition to the pair’s sustained trading below a month-long resistance line and 100-bar moving average on the 4-hour chart (4H 100MA), the USD/INR pair’s recent U-turn from 23.6% Fibonacci retracement also portrays the quote’s weakness as it takes the rounds to 68.54 during early Monday.
With this, chances of its drop to 0.6825/18 region comprising recent low and immediate declining support-line seem brighter.
Should prices keep falling below 68.18, late-June 2018 low near 67.68 could lure sellers.
Alternatively, 23.6% Fibonacci retracement of the pair’s south-run since mid-June can limit immediate upside around 68.70 whereas aforementioned trend-line and 4H 100MA can follow the suit afterward around 68.73 and 68.91.
Given the buyers’ ability to clear 68.91 resistance, 50% Fibonacci retracement around 69.20 becomes their choice.
USD/INR 4-hour chart
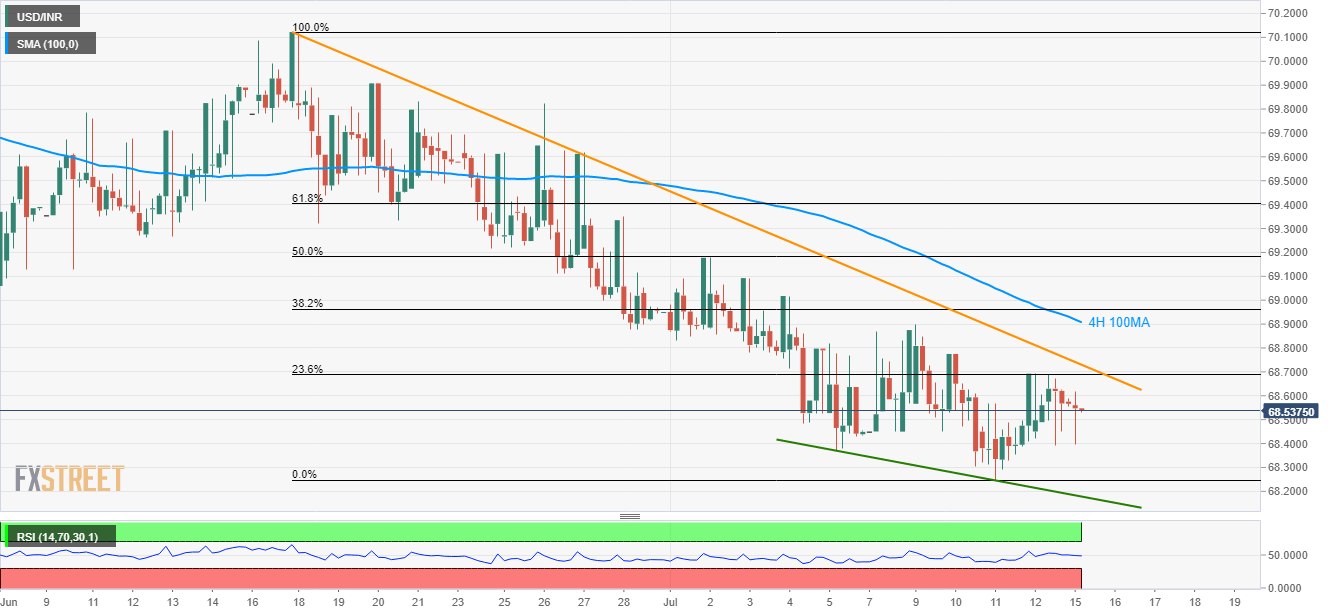
Trend: Bearish
