- Sustained trading below April month low highlights the importance of February bottom.
- Oversold RSI questions further downside.
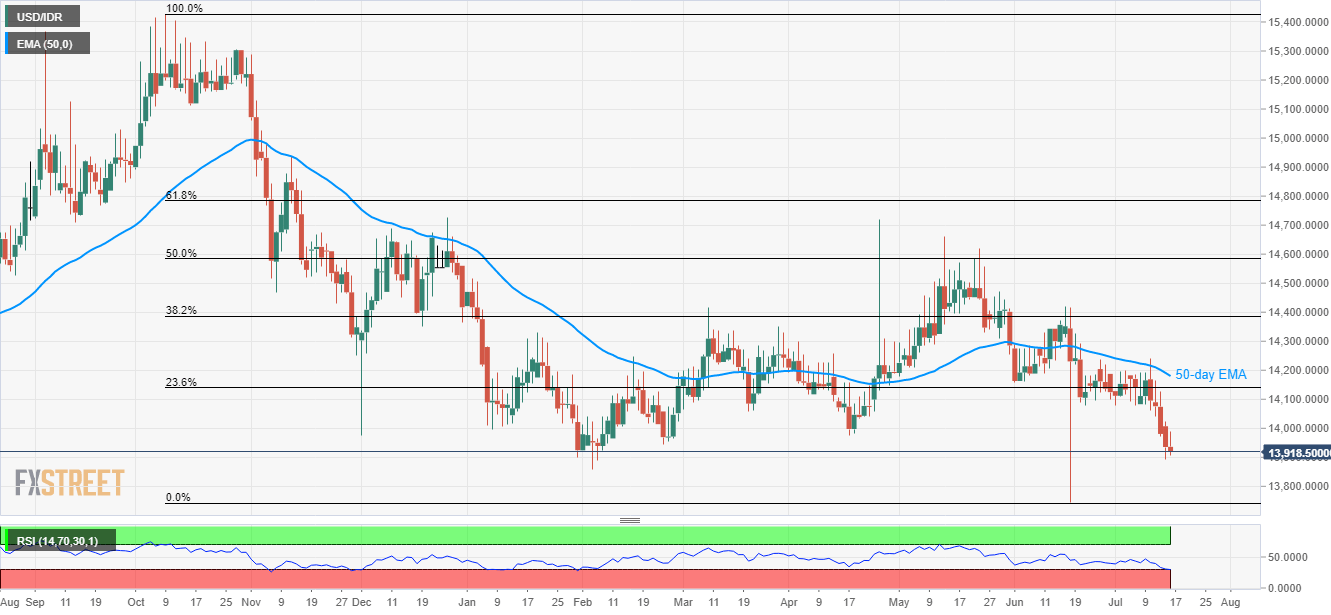
With the sustained trading below April low, the USD/IDR pair aims for February trough while taking the rounds to 13,920 during early Tuesday.
While 13,858 acts as the key immediate support, oversold conditions of 14-day relative strength index (RSI) indicate less likelihood for the quote’s further declines, which if ignored can recall 13,750 back to the chart.
On the upside, April month low surrounding 13,975, followed by 14,000 round-figure continues to limit near-term advances ahead of diverting market attention to 23.6% Fibonacci retracement level of October 2018 to June 2019 downpour at 14,140.
Should there be an increased buying momentum past-14,140, investors can look for 50-day exponential moving average (50-day EMA) level of 14,180 as the next important resistance.
USD/IDR daily chart
Trend: Pullback expected
