- 21-day EMA holds the key to the USD/INR pair’s recovery towards a month-old resistance-line.
- A downside break of 68.24 can flash sub-68.00 figure on the chart.
Despite recovering from a year old horizontal support, USD/INR still lags past-key short-term resistance as it trades near 68.55 ahead of European open on Tuesday.
Sellers can dominate once the year-long horizontal support area around 68.25/24 breaks, the same opens the gate for the pair’s declines towards June 2018 low around 67.6850 with 67.965 being an intermediate halt.
On the upside clearance of 68.85 mark comprising 21-day exponential moving average (EMA), the quote can rise towards a month-old descending trend-line resistance, at 69.40.
In a case where prices rise past-69.40, bulls can aim for 61.8% Fibonacci retracement level of late-2018 downpour near 69.92 ahead of targeting 70.00 round-figure.
USD/INR daily chart
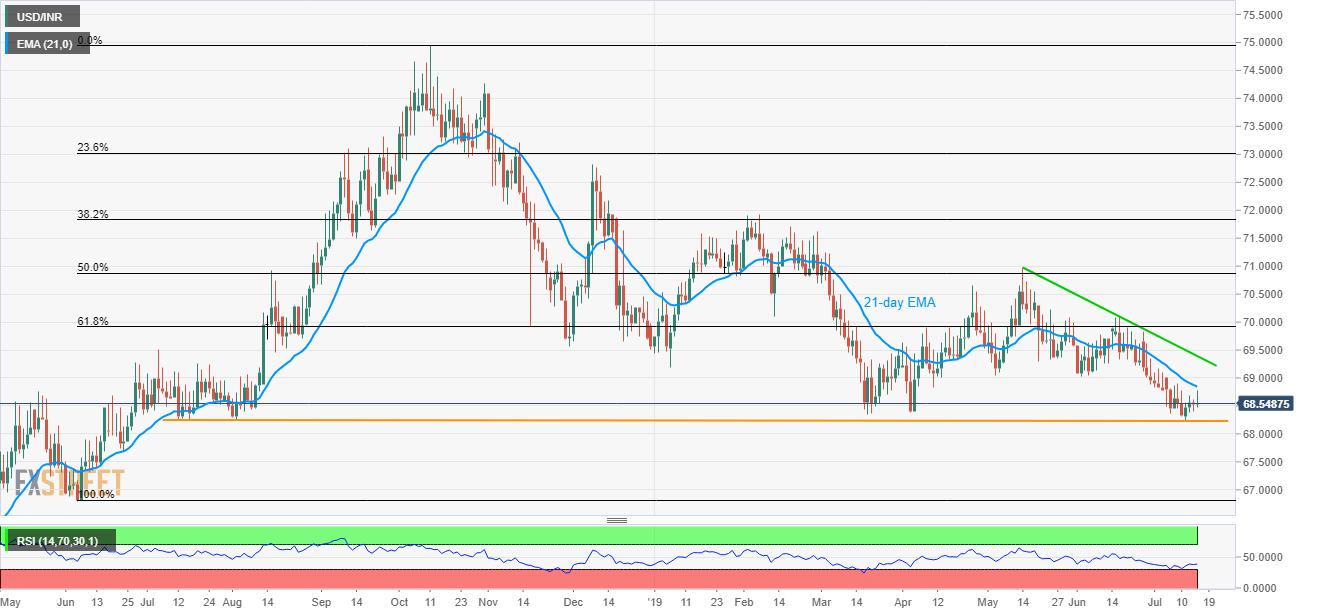
Trend: Bearish
