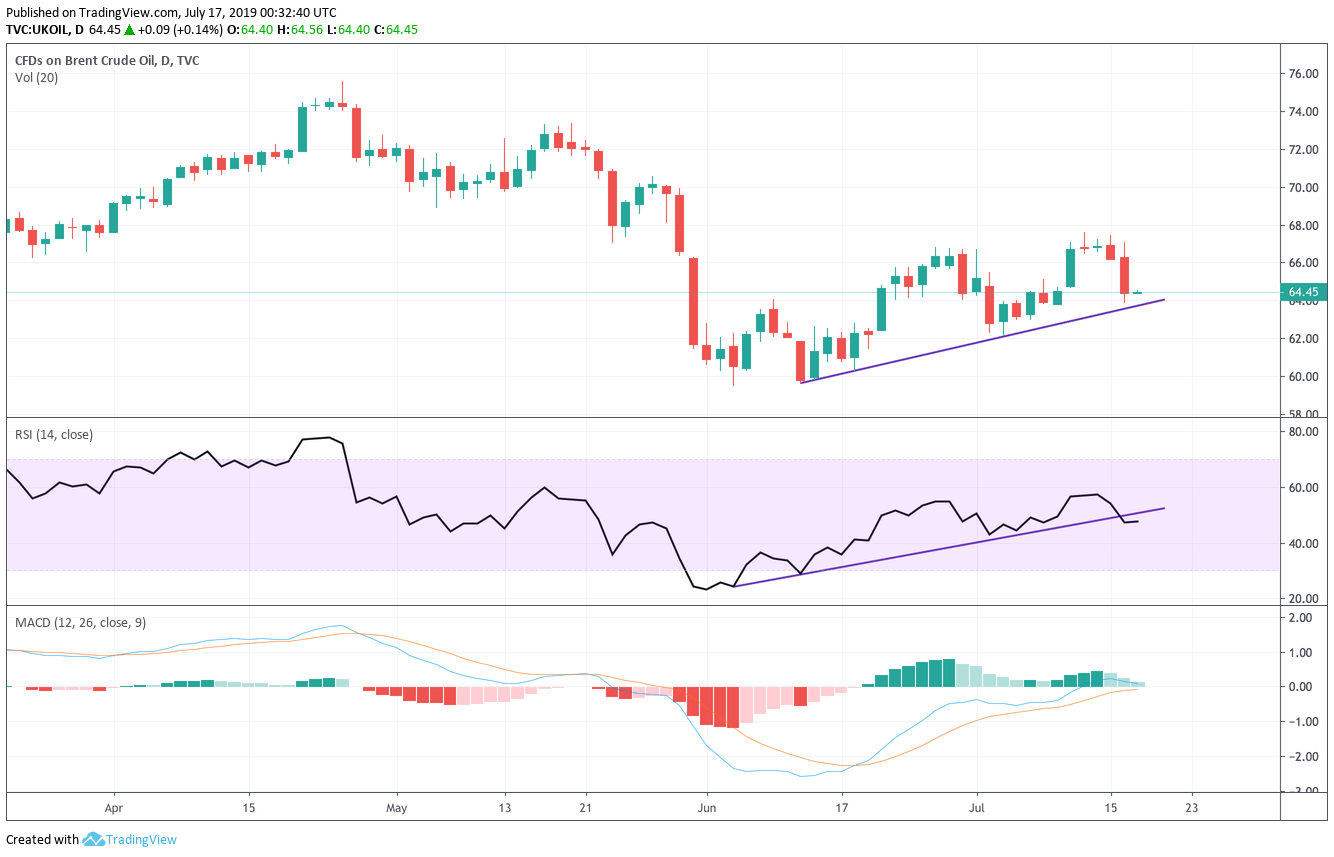
- Brent’s daily chart shows a bearish doji reversal.
- Daily chart indicators are biased bearish.
- Oil risks falling to key support sat $63.75.
Brent oil fell 2.72% on Monday, having carved out a bearish doji reversal pattern in the preceding two trading days, as discussed yesterday.
With the price drop, the 14-day relative strength index has dived out of the ascending trendline, confirming an end of the rally from June lows near $59.50.
More importantly, the RSI is now reporting bearish conditions with a below-50 print.
The moving average convergence divergence (MACD) histogram is also teasing a bearish crossover (drop bellow zero).
All-in-all, Brent looks set to test the support of the trendline connecting June 12 and July 3 lows. As of writing, that trendline support is located at 63..75 and a barrel of Brent is changing hands at $64.50.
Daily chart
Trend: Bearish
Pivot points
