- A medium-term descending trend-line support seems capable enough to trigger GBP/USD pullback amid oversold RSI levels.
- 1.2580/85 is likely immediate key resistance to watch.
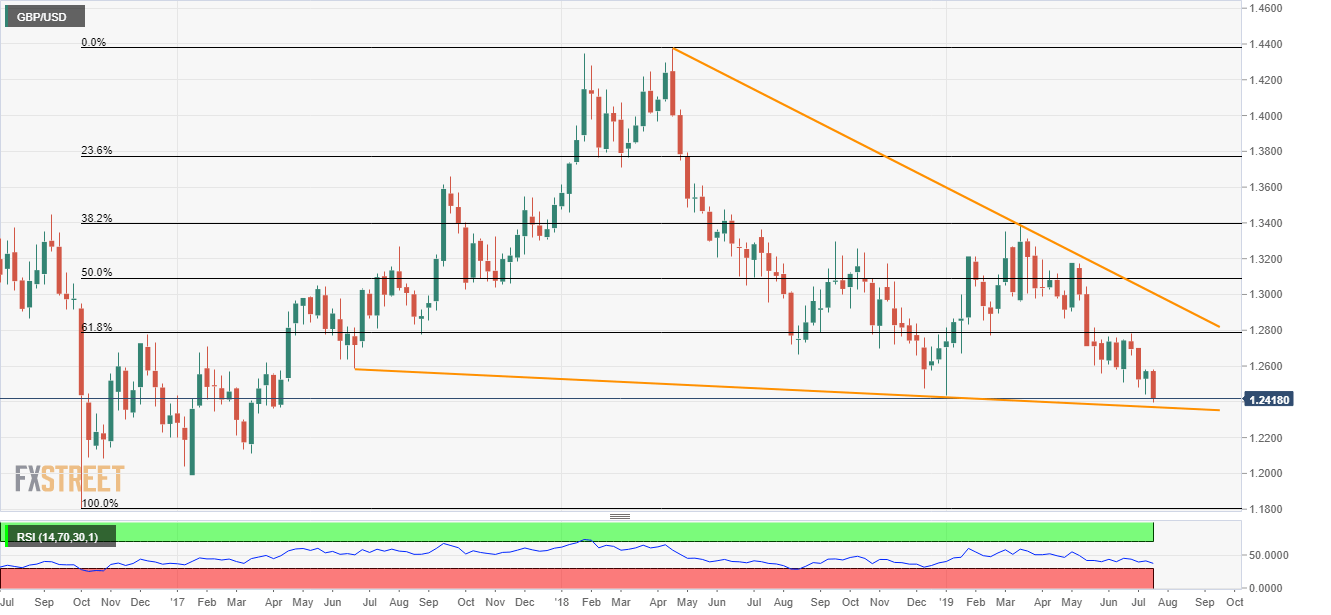
Even after declining to a fresh 27-month low, the GBP/USD pair is yet to slip beneath key support-line as it takes the rounds to 1.2418 while heading into the UK session on Wednesday.
A downward sloping trend-line stretched since June 2017, at 1.2370, acts as nearby and crucial support for sellers to watch amid oversold levels of 14-bar relative strength index (RSI).
If bears refrain from respecting 1.2370, late-March 2017 low surrounding 1.2335/40 and the same month bottom around 1.2110 could be on their radars.
Meanwhile, lows marked during June 18 and July 12 near 1.2510 act as adjacent resistance, a break of which can trigger the pair’s recovery to weekly top close to 1.2580.
On a broader view, 1.2785/90 area comprising June month high could be watched as a key to the upside.
GBP/USD weekly chart
Trend: Pullback expected
