- 21 and 50 hourly moving averages (HMAs), coupled with 23.6% Fibonacci retracement, limit the GBP/USD pair’s near-term declines.
- Buyers wait for a sustained run-up beyond 1.2462.
With the key short-term moving averages and Fibonacci retracement levels limiting the downside, GBP/USD takes the rounds to 1.2438 heading into the UK open on Thursday.
While strong supports limit the quote’s declines, buyers await a successful rise beyond 38.2% Fibonacci retracement of 2-week old trade moves, at 1.2462, in order to register fresh upside towards 50% and 61.8% Fibonacci retracement levels, 1.2488 and 1.2512 respectively.
It should also be noted that the pair’s rise past-1.2512 might not refrain from questioning mid-month high around 1.2580.
In a case prices slip beneath 1.2432/28 support-confluence, 1.2400 and recent low surrounding 1.2380 may entertain sellers targeting 1.2300 round-figure.
GBP/USD hourly chart
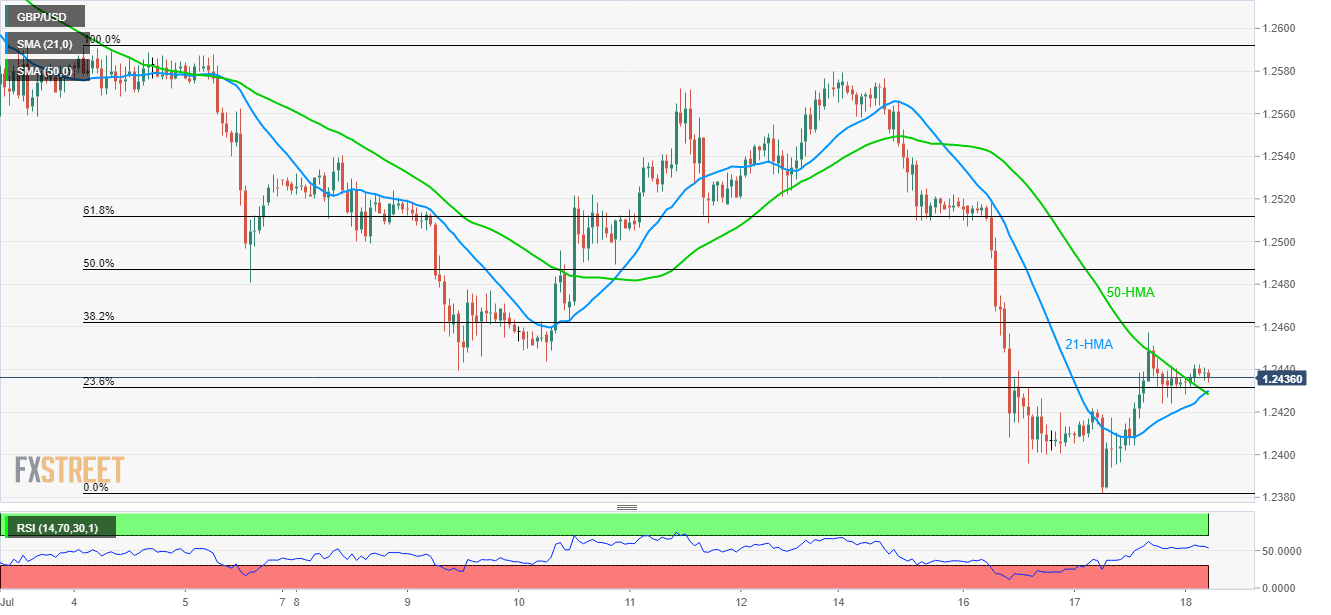
Trend: Sideways
