- Brent has recovered from one-month lows.
- The corrective bounce could be extended further to key MA at $63.80
Brent oil’s recovery from the one-month low off $61.32 could be extended further to key resistance at $63.80 on the hourly chart.
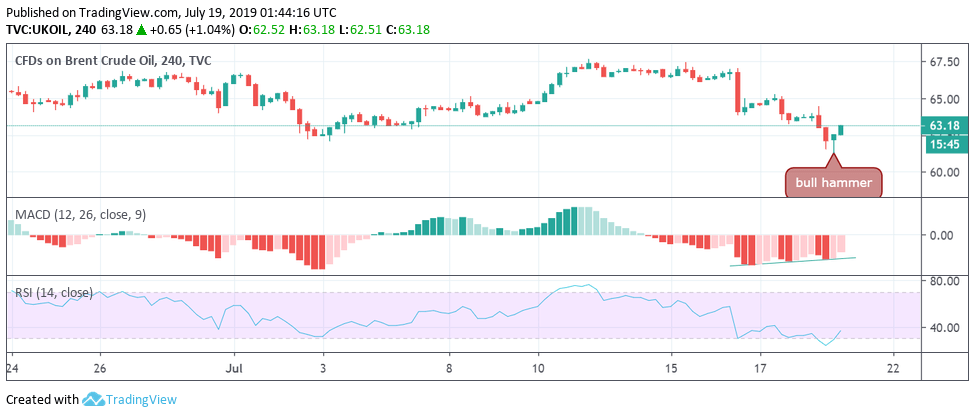
Sings of seller exhaustion have emerged on the 4-hour chart in the form of oversold readings on the relative strength index, bullish divergence of the MACD and a long-tailed bullish hammer.
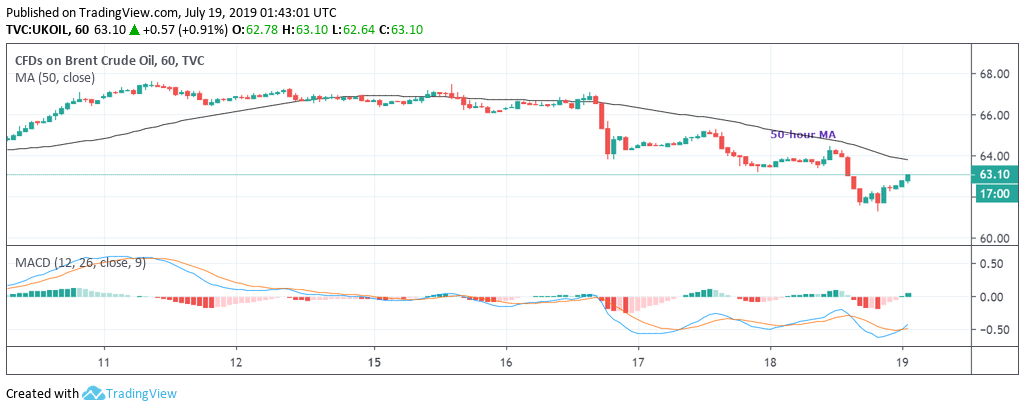
Further, the MACD on the hourly chart has turned bullish. So the black gold could rise toward the 50-hour moving average, currently at $63.80, in the next few hours.
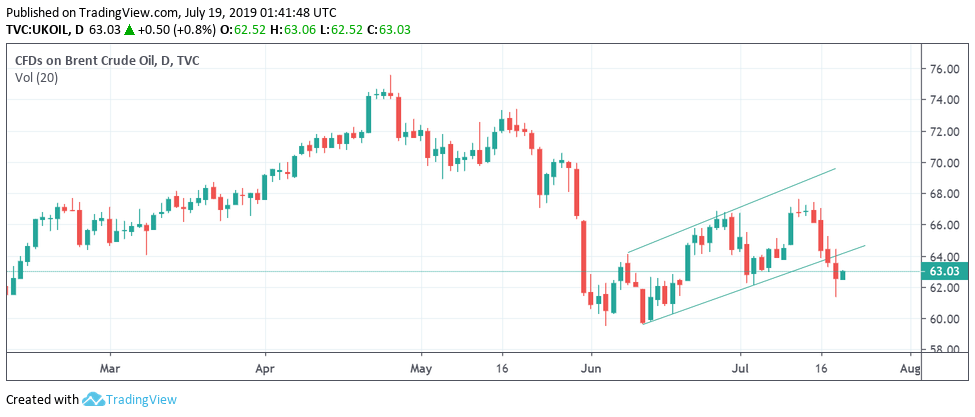
The overall outlook remains bearish with the daily chart reporting a rising channel breakdown.
4-hour chart
Hourly chart
Daily chart
Trend: Corrective bounce
Pivot points
